Immigrants from Canada vs Immigrants from Asia Disability Age Under 5
COMPARE
Immigrants from Canada
Immigrants from Asia
Disability Age Under 5
Disability Age Under 5 Comparison
Immigrants from Canada
Immigrants from Asia
1.4%
DISABILITY AGE UNDER 5
0.1/ 100
METRIC RATING
271st/ 347
METRIC RANK
1.1%
DISABILITY AGE UNDER 5
99.8/ 100
METRIC RATING
44th/ 347
METRIC RANK
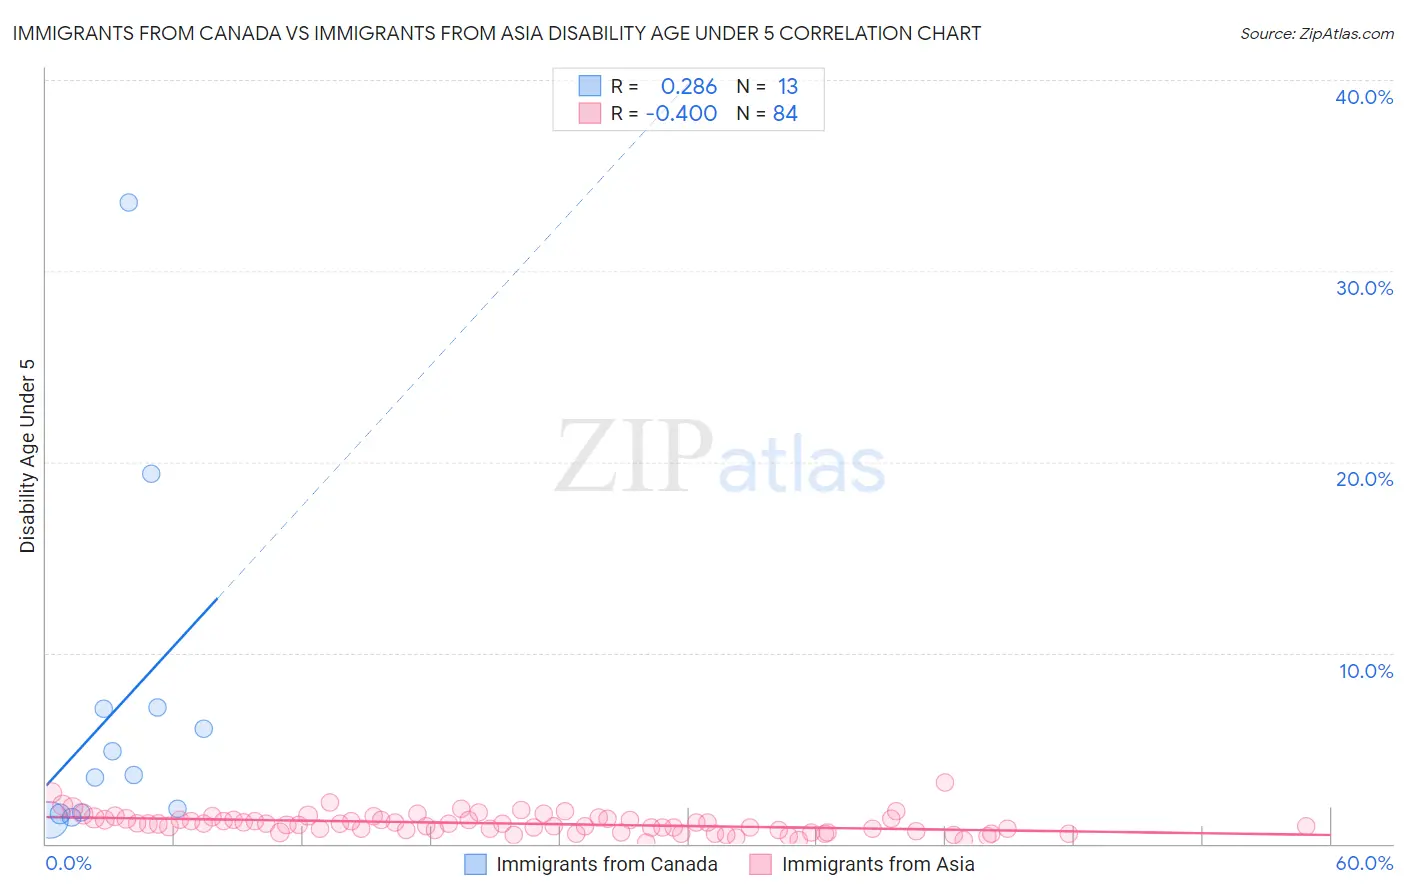
Immigrants from Canada vs Immigrants from Asia Disability Age Under 5 Correlation Chart
The statistical analysis conducted on geographies consisting of 233,728,929 people shows a weak positive correlation between the proportion of Immigrants from Canada and percentage of population with a disability under the age of 5 in the United States with a correlation coefficient (R) of 0.286 and weighted average of 1.4%. Similarly, the statistical analysis conducted on geographies consisting of 258,370,039 people shows a moderate negative correlation between the proportion of Immigrants from Asia and percentage of population with a disability under the age of 5 in the United States with a correlation coefficient (R) of -0.400 and weighted average of 1.1%, a difference of 35.9%.
Disability Age Under 5 Correlation Summary
| Measurement | Immigrants from Canada | Immigrants from Asia |
| Minimum | 1.3% | 0.058% |
| Maximum | 33.6% | 3.2% |
| Range | 32.3% | 3.2% |
| Mean | 7.1% | 1.1% |
| Median | 3.6% | 1.0% |
| Interquartile 25% (IQ1) | 1.6% | 0.72% |
| Interquartile 75% (IQ3) | 7.1% | 1.3% |
| Interquartile Range (IQR) | 5.5% | 0.57% |
| Standard Deviation (Sample) | 9.3% | 0.53% |
| Standard Deviation (Population) | 8.9% | 0.53% |
Similar Demographics by Disability Age Under 5
Demographics Similar to Immigrants from Canada by Disability Age Under 5
In terms of disability age under 5, the demographic groups most similar to Immigrants from Canada are Immigrants from North America (1.4%, a difference of 0.040%), Black/African American (1.4%, a difference of 0.16%), Austrian (1.4%, a difference of 0.17%), Belgian (1.4%, a difference of 0.35%), and Alaskan Athabascan (1.5%, a difference of 0.46%).
| Demographics | Rating | Rank | Disability Age Under 5 |
| Yugoslavians | 0.1 /100 | #264 | Tragic 1.4% |
| Carpatho Rusyns | 0.1 /100 | #265 | Tragic 1.4% |
| Immigrants | Germany | 0.1 /100 | #266 | Tragic 1.4% |
| Cree | 0.1 /100 | #267 | Tragic 1.4% |
| Belgians | 0.1 /100 | #268 | Tragic 1.4% |
| Austrians | 0.1 /100 | #269 | Tragic 1.4% |
| Immigrants | North America | 0.1 /100 | #270 | Tragic 1.4% |
| Immigrants | Canada | 0.1 /100 | #271 | Tragic 1.4% |
| Blacks/African Americans | 0.1 /100 | #272 | Tragic 1.4% |
| Alaskan Athabascans | 0.1 /100 | #273 | Tragic 1.5% |
| Iroquois | 0.0 /100 | #274 | Tragic 1.5% |
| Brazilians | 0.0 /100 | #275 | Tragic 1.5% |
| Greeks | 0.0 /100 | #276 | Tragic 1.5% |
| Canadians | 0.0 /100 | #277 | Tragic 1.5% |
| Kiowa | 0.0 /100 | #278 | Tragic 1.5% |
Demographics Similar to Immigrants from Asia by Disability Age Under 5
In terms of disability age under 5, the demographic groups most similar to Immigrants from Asia are Pima (1.1%, a difference of 0.090%), Immigrants from Bulgaria (1.1%, a difference of 0.11%), Thai (1.1%, a difference of 0.21%), Immigrants from Turkey (1.1%, a difference of 0.22%), and Immigrants from Albania (1.1%, a difference of 0.61%).
| Demographics | Rating | Rank | Disability Age Under 5 |
| Immigrants | India | 99.9 /100 | #37 | Exceptional 1.0% |
| Immigrants | Guyana | 99.9 /100 | #38 | Exceptional 1.0% |
| Filipinos | 99.9 /100 | #39 | Exceptional 1.1% |
| Immigrants | Albania | 99.9 /100 | #40 | Exceptional 1.1% |
| Thais | 99.8 /100 | #41 | Exceptional 1.1% |
| Immigrants | Bulgaria | 99.8 /100 | #42 | Exceptional 1.1% |
| Pima | 99.8 /100 | #43 | Exceptional 1.1% |
| Immigrants | Asia | 99.8 /100 | #44 | Exceptional 1.1% |
| Immigrants | Turkey | 99.8 /100 | #45 | Exceptional 1.1% |
| Immigrants | Congo | 99.8 /100 | #46 | Exceptional 1.1% |
| Immigrants | Sweden | 99.8 /100 | #47 | Exceptional 1.1% |
| Immigrants | Singapore | 99.7 /100 | #48 | Exceptional 1.1% |
| Immigrants | Russia | 99.7 /100 | #49 | Exceptional 1.1% |
| Immigrants | Japan | 99.7 /100 | #50 | Exceptional 1.1% |
| Immigrants | Kazakhstan | 99.7 /100 | #51 | Exceptional 1.1% |