Immigrants from Canada vs Cuban Kindergarten
COMPARE
Immigrants from Canada
Cuban
Kindergarten
Kindergarten Comparison
Immigrants from Canada
Cubans
98.4%
KINDERGARTEN
99.7/ 100
METRIC RATING
59th/ 347
METRIC RANK
97.5%
KINDERGARTEN
0.3/ 100
METRIC RATING
265th/ 347
METRIC RANK
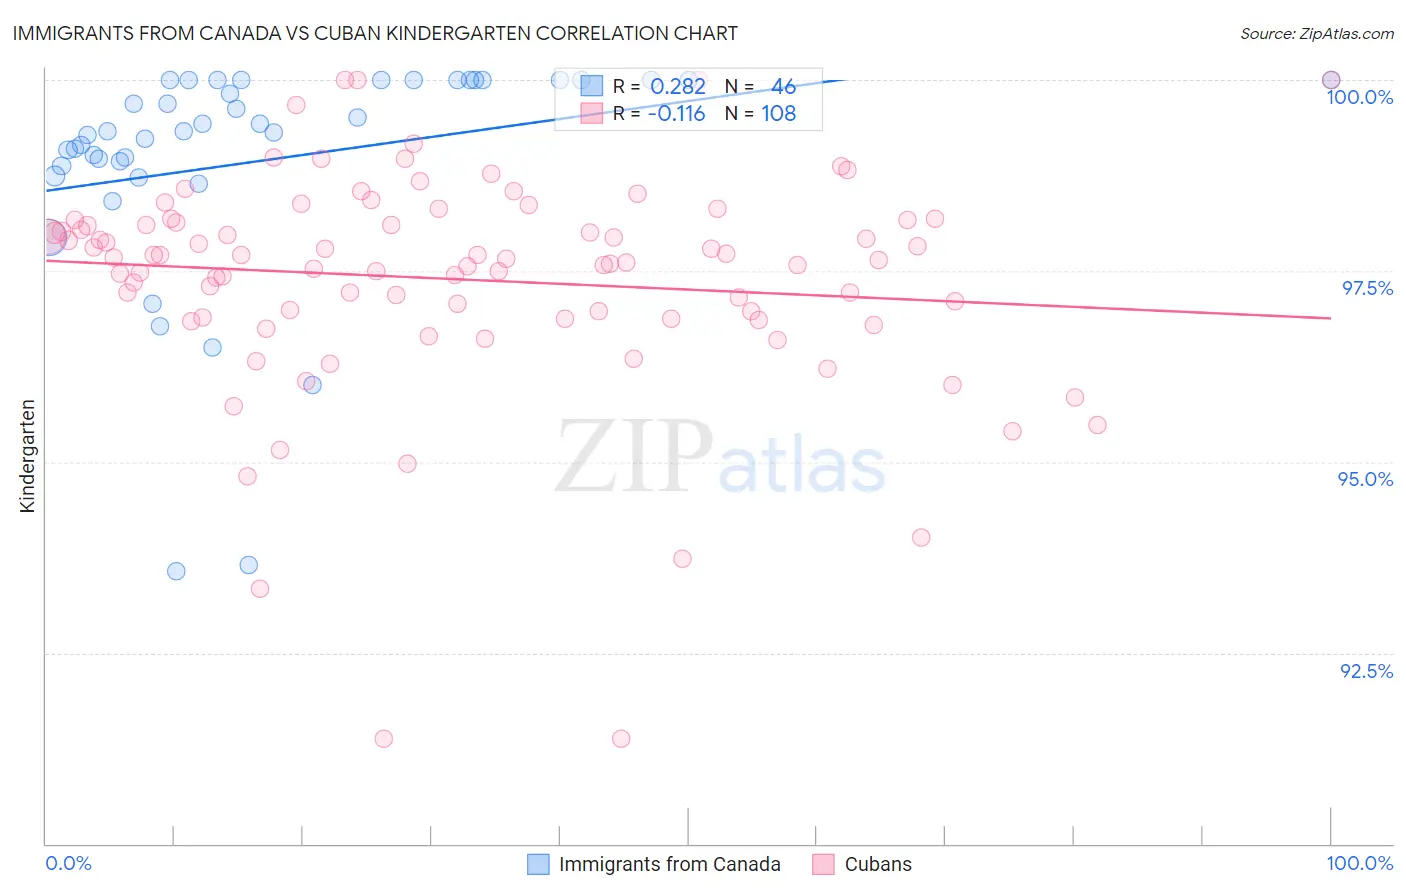
Immigrants from Canada vs Cuban Kindergarten Correlation Chart
The statistical analysis conducted on geographies consisting of 459,397,554 people shows a weak positive correlation between the proportion of Immigrants from Canada and percentage of population with at least kindergarten education in the United States with a correlation coefficient (R) of 0.282 and weighted average of 98.4%. Similarly, the statistical analysis conducted on geographies consisting of 449,326,865 people shows a poor negative correlation between the proportion of Cubans and percentage of population with at least kindergarten education in the United States with a correlation coefficient (R) of -0.116 and weighted average of 97.5%, a difference of 0.90%.
Kindergarten Correlation Summary
| Measurement | Immigrants from Canada | Cuban |
| Minimum | 93.6% | 91.4% |
| Maximum | 100.0% | 100.0% |
| Range | 6.4% | 8.6% |
| Mean | 99.0% | 97.4% |
| Median | 99.3% | 97.7% |
| Interquartile 25% (IQ1) | 98.9% | 96.9% |
| Interquartile 75% (IQ3) | 100.0% | 98.1% |
| Interquartile Range (IQR) | 1.1% | 1.3% |
| Standard Deviation (Sample) | 1.5% | 1.5% |
| Standard Deviation (Population) | 1.5% | 1.5% |
Similar Demographics by Kindergarten
Demographics Similar to Immigrants from Canada by Kindergarten
In terms of kindergarten, the demographic groups most similar to Immigrants from Canada are Bulgarian (98.4%, a difference of 0.0%), Creek (98.4%, a difference of 0.0%), Slavic (98.4%, a difference of 0.0%), New Zealander (98.4%, a difference of 0.0%), and Immigrants from North America (98.4%, a difference of 0.0%).
| Demographics | Rating | Rank | Kindergarten |
| Australians | 99.8 /100 | #52 | Exceptional 98.4% |
| Celtics | 99.8 /100 | #53 | Exceptional 98.4% |
| Pueblo | 99.8 /100 | #54 | Exceptional 98.4% |
| Immigrants | Scotland | 99.8 /100 | #55 | Exceptional 98.4% |
| Americans | 99.8 /100 | #56 | Exceptional 98.4% |
| Austrians | 99.8 /100 | #57 | Exceptional 98.4% |
| Bulgarians | 99.7 /100 | #58 | Exceptional 98.4% |
| Immigrants | Canada | 99.7 /100 | #59 | Exceptional 98.4% |
| Creek | 99.7 /100 | #60 | Exceptional 98.4% |
| Slavs | 99.7 /100 | #61 | Exceptional 98.4% |
| New Zealanders | 99.7 /100 | #62 | Exceptional 98.4% |
| Immigrants | North America | 99.7 /100 | #63 | Exceptional 98.4% |
| Greeks | 99.7 /100 | #64 | Exceptional 98.4% |
| Maltese | 99.7 /100 | #65 | Exceptional 98.4% |
| Cheyenne | 99.6 /100 | #66 | Exceptional 98.4% |
Demographics Similar to Cubans by Kindergarten
In terms of kindergarten, the demographic groups most similar to Cubans are Immigrants from Sierra Leone (97.5%, a difference of 0.0%), Immigrants from Liberia (97.5%, a difference of 0.010%), Immigrants from Nigeria (97.5%, a difference of 0.010%), Fijian (97.5%, a difference of 0.020%), and Taiwanese (97.5%, a difference of 0.020%).
| Demographics | Rating | Rank | Kindergarten |
| Jamaicans | 0.6 /100 | #258 | Tragic 97.6% |
| Armenians | 0.5 /100 | #259 | Tragic 97.6% |
| Fijians | 0.5 /100 | #260 | Tragic 97.5% |
| Taiwanese | 0.4 /100 | #261 | Tragic 97.5% |
| Immigrants | Ethiopia | 0.4 /100 | #262 | Tragic 97.5% |
| Immigrants | South America | 0.4 /100 | #263 | Tragic 97.5% |
| Assyrians/Chaldeans/Syriacs | 0.4 /100 | #264 | Tragic 97.5% |
| Cubans | 0.3 /100 | #265 | Tragic 97.5% |
| Immigrants | Sierra Leone | 0.3 /100 | #266 | Tragic 97.5% |
| Immigrants | Liberia | 0.3 /100 | #267 | Tragic 97.5% |
| Immigrants | Nigeria | 0.3 /100 | #268 | Tragic 97.5% |
| West Indians | 0.3 /100 | #269 | Tragic 97.5% |
| Immigrants | Jamaica | 0.2 /100 | #270 | Tragic 97.5% |
| Immigrants | Peru | 0.2 /100 | #271 | Tragic 97.5% |
| Immigrants | Bolivia | 0.2 /100 | #272 | Tragic 97.5% |