Immigrants from Canada vs Laotian Disability Age Under 5
COMPARE
Immigrants from Canada
Laotian
Disability Age Under 5
Disability Age Under 5 Comparison
Immigrants from Canada
Laotians
1.4%
DISABILITY AGE UNDER 5
0.1/ 100
METRIC RATING
271st/ 347
METRIC RANK
1.2%
DISABILITY AGE UNDER 5
62.8/ 100
METRIC RATING
164th/ 347
METRIC RANK
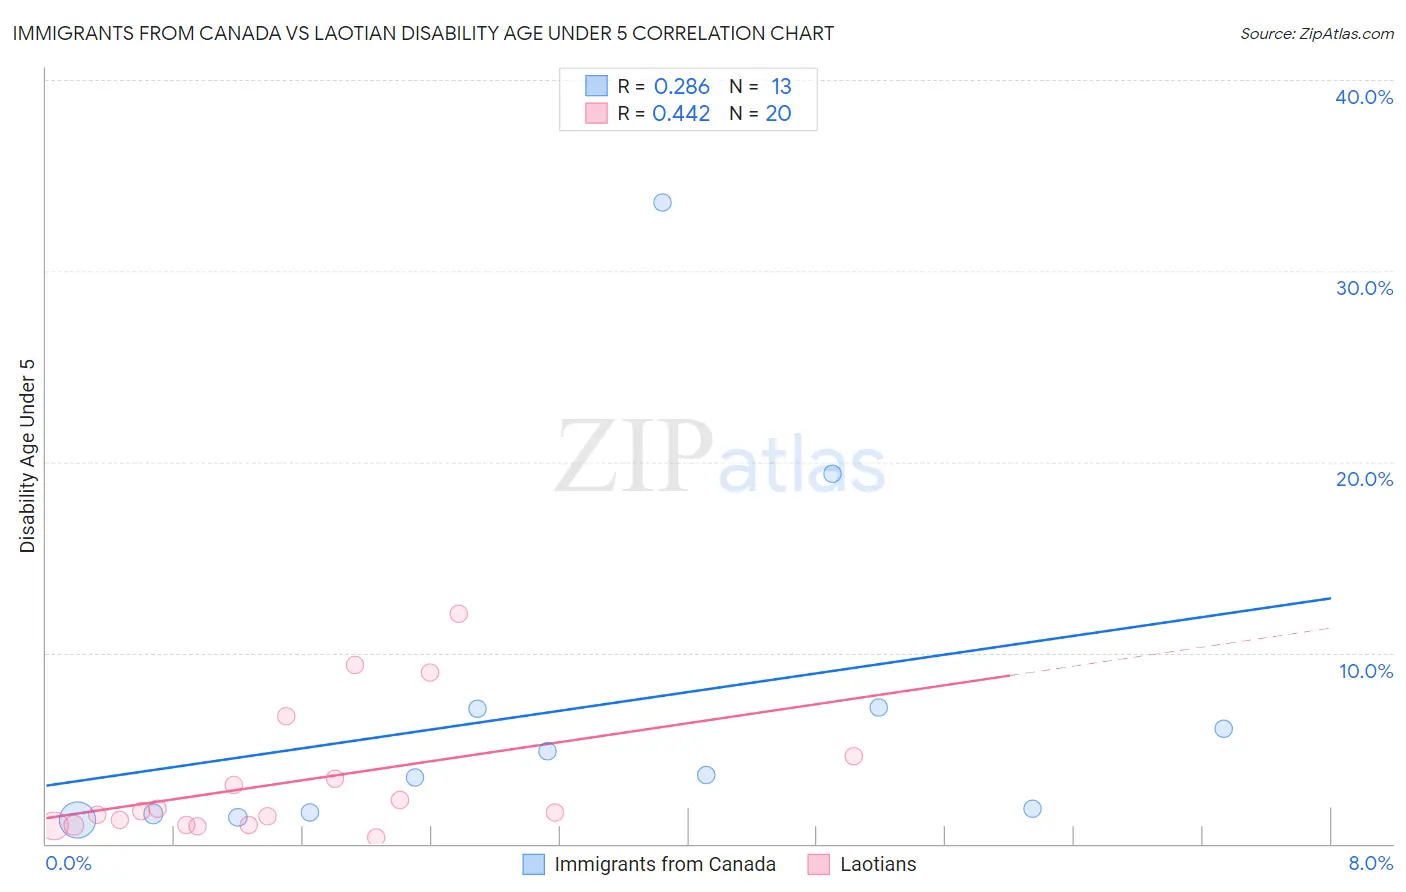
Immigrants from Canada vs Laotian Disability Age Under 5 Correlation Chart
The statistical analysis conducted on geographies consisting of 233,728,929 people shows a weak positive correlation between the proportion of Immigrants from Canada and percentage of population with a disability under the age of 5 in the United States with a correlation coefficient (R) of 0.286 and weighted average of 1.4%. Similarly, the statistical analysis conducted on geographies consisting of 148,180,930 people shows a moderate positive correlation between the proportion of Laotians and percentage of population with a disability under the age of 5 in the United States with a correlation coefficient (R) of 0.442 and weighted average of 1.2%, a difference of 17.8%.
Disability Age Under 5 Correlation Summary
| Measurement | Immigrants from Canada | Laotian |
| Minimum | 1.3% | 0.35% |
| Maximum | 33.6% | 12.0% |
| Range | 32.3% | 11.7% |
| Mean | 7.1% | 3.2% |
| Median | 3.6% | 1.7% |
| Interquartile 25% (IQ1) | 1.6% | 0.97% |
| Interquartile 75% (IQ3) | 7.1% | 4.0% |
| Interquartile Range (IQR) | 5.5% | 3.0% |
| Standard Deviation (Sample) | 9.3% | 3.4% |
| Standard Deviation (Population) | 8.9% | 3.3% |
Similar Demographics by Disability Age Under 5
Demographics Similar to Immigrants from Canada by Disability Age Under 5
In terms of disability age under 5, the demographic groups most similar to Immigrants from Canada are Immigrants from North America (1.4%, a difference of 0.040%), Black/African American (1.4%, a difference of 0.16%), Austrian (1.4%, a difference of 0.17%), Belgian (1.4%, a difference of 0.35%), and Alaskan Athabascan (1.5%, a difference of 0.46%).
| Demographics | Rating | Rank | Disability Age Under 5 |
| Yugoslavians | 0.1 /100 | #264 | Tragic 1.4% |
| Carpatho Rusyns | 0.1 /100 | #265 | Tragic 1.4% |
| Immigrants | Germany | 0.1 /100 | #266 | Tragic 1.4% |
| Cree | 0.1 /100 | #267 | Tragic 1.4% |
| Belgians | 0.1 /100 | #268 | Tragic 1.4% |
| Austrians | 0.1 /100 | #269 | Tragic 1.4% |
| Immigrants | North America | 0.1 /100 | #270 | Tragic 1.4% |
| Immigrants | Canada | 0.1 /100 | #271 | Tragic 1.4% |
| Blacks/African Americans | 0.1 /100 | #272 | Tragic 1.4% |
| Alaskan Athabascans | 0.1 /100 | #273 | Tragic 1.5% |
| Iroquois | 0.0 /100 | #274 | Tragic 1.5% |
| Brazilians | 0.0 /100 | #275 | Tragic 1.5% |
| Greeks | 0.0 /100 | #276 | Tragic 1.5% |
| Canadians | 0.0 /100 | #277 | Tragic 1.5% |
| Kiowa | 0.0 /100 | #278 | Tragic 1.5% |
Demographics Similar to Laotians by Disability Age Under 5
In terms of disability age under 5, the demographic groups most similar to Laotians are Immigrants from Kuwait (1.2%, a difference of 0.020%), Immigrants from Guatemala (1.2%, a difference of 0.050%), Guatemalan (1.2%, a difference of 0.080%), Immigrants from Central America (1.2%, a difference of 0.13%), and Immigrants from Africa (1.2%, a difference of 0.23%).
| Demographics | Rating | Rank | Disability Age Under 5 |
| Immigrants | South America | 67.0 /100 | #157 | Good 1.2% |
| Arabs | 66.4 /100 | #158 | Good 1.2% |
| Colombians | 65.8 /100 | #159 | Good 1.2% |
| Immigrants | Latin America | 65.8 /100 | #160 | Good 1.2% |
| Immigrants | Africa | 65.1 /100 | #161 | Good 1.2% |
| Guatemalans | 63.6 /100 | #162 | Good 1.2% |
| Immigrants | Guatemala | 63.2 /100 | #163 | Good 1.2% |
| Laotians | 62.8 /100 | #164 | Good 1.2% |
| Immigrants | Kuwait | 62.6 /100 | #165 | Good 1.2% |
| Immigrants | Central America | 61.4 /100 | #166 | Good 1.2% |
| Immigrants | Argentina | 60.2 /100 | #167 | Good 1.2% |
| Sierra Leoneans | 59.1 /100 | #168 | Average 1.2% |
| Immigrants | Uruguay | 59.0 /100 | #169 | Average 1.2% |
| Immigrants | Jamaica | 58.8 /100 | #170 | Average 1.2% |
| Guamanians/Chamorros | 57.8 /100 | #171 | Average 1.2% |