Immigrants from Canada vs Cuban In Labor Force | Age 20-24
COMPARE
Immigrants from Canada
Cuban
In Labor Force | Age 20-24
In Labor Force | Age 20-24 Comparison
Immigrants from Canada
Cubans
75.9%
IN LABOR FORCE | AGE 20-24
95.6/ 100
METRIC RATING
112th/ 347
METRIC RANK
72.5%
IN LABOR FORCE | AGE 20-24
0.0/ 100
METRIC RATING
301st/ 347
METRIC RANK
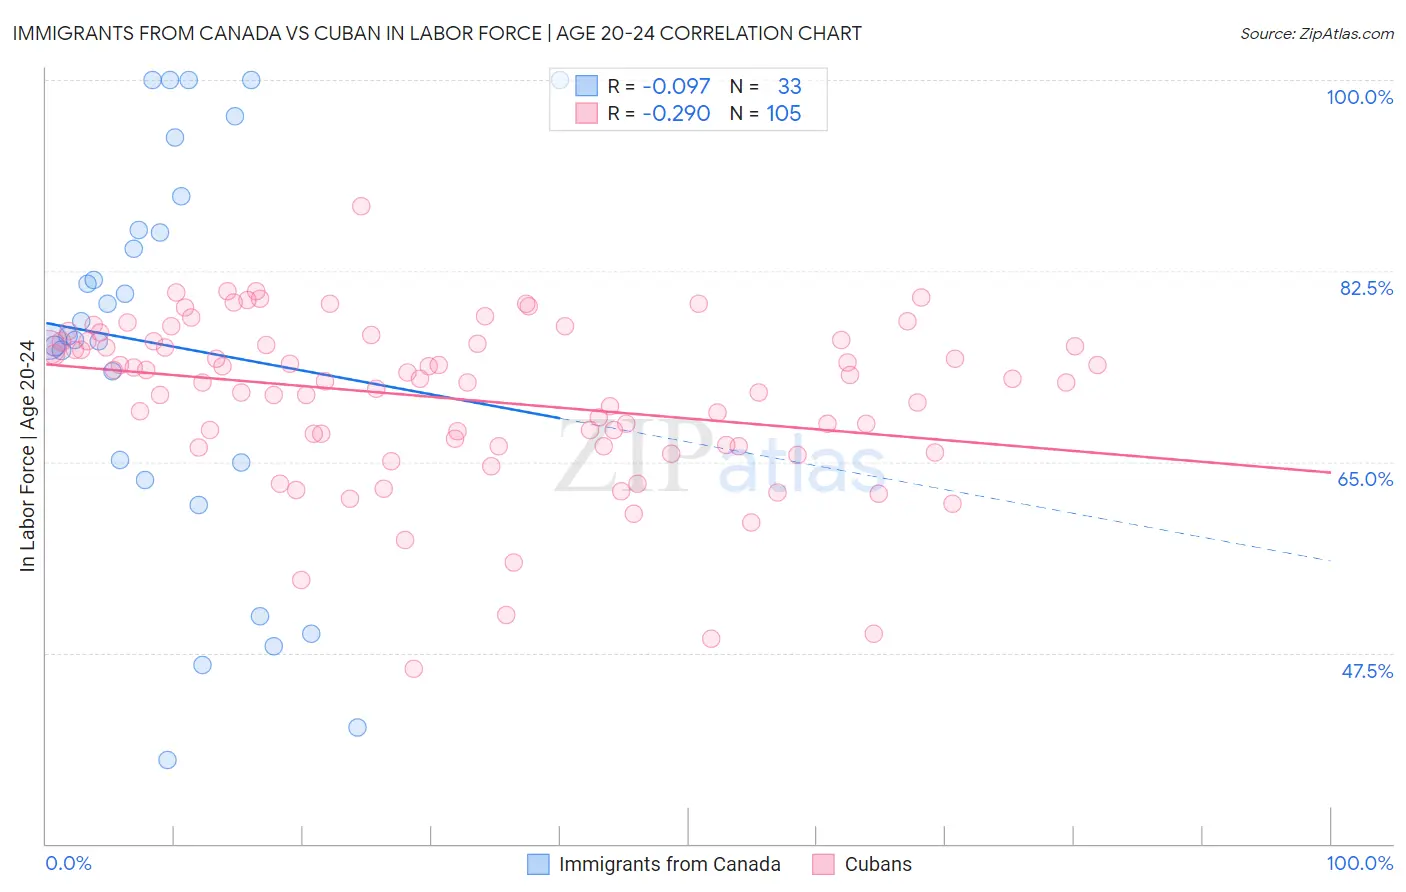
Immigrants from Canada vs Cuban In Labor Force | Age 20-24 Correlation Chart
The statistical analysis conducted on geographies consisting of 458,968,700 people shows a slight negative correlation between the proportion of Immigrants from Canada and labor force participation rate among population between the ages 20 and 24 in the United States with a correlation coefficient (R) of -0.097 and weighted average of 75.9%. Similarly, the statistical analysis conducted on geographies consisting of 449,113,848 people shows a weak negative correlation between the proportion of Cubans and labor force participation rate among population between the ages 20 and 24 in the United States with a correlation coefficient (R) of -0.290 and weighted average of 72.5%, a difference of 4.7%.
In Labor Force | Age 20-24 Correlation Summary
| Measurement | Immigrants from Canada | Cuban |
| Minimum | 37.7% | 46.0% |
| Maximum | 100.0% | 88.4% |
| Range | 62.3% | 42.4% |
| Mean | 75.6% | 70.8% |
| Median | 76.5% | 72.4% |
| Interquartile 25% (IQ1) | 64.1% | 66.4% |
| Interquartile 75% (IQ3) | 87.8% | 76.0% |
| Interquartile Range (IQR) | 23.6% | 9.6% |
| Standard Deviation (Sample) | 18.2% | 7.6% |
| Standard Deviation (Population) | 17.9% | 7.6% |
Similar Demographics by In Labor Force | Age 20-24
Demographics Similar to Immigrants from Canada by In Labor Force | Age 20-24
In terms of in labor force | age 20-24, the demographic groups most similar to Immigrants from Canada are Ukrainian (75.9%, a difference of 0.010%), Cherokee (75.9%, a difference of 0.020%), Immigrants from Morocco (75.9%, a difference of 0.020%), Immigrants from Netherlands (75.9%, a difference of 0.030%), and Immigrants from Zimbabwe (75.9%, a difference of 0.040%).
| Demographics | Rating | Rank | In Labor Force | Age 20-24 |
| Immigrants | Nepal | 97.2 /100 | #105 | Exceptional 76.0% |
| Immigrants | Uganda | 97.1 /100 | #106 | Exceptional 76.0% |
| Greeks | 96.9 /100 | #107 | Exceptional 76.0% |
| Iraqis | 96.6 /100 | #108 | Exceptional 76.0% |
| Cherokee | 95.8 /100 | #109 | Exceptional 75.9% |
| Immigrants | Morocco | 95.8 /100 | #110 | Exceptional 75.9% |
| Ukrainians | 95.7 /100 | #111 | Exceptional 75.9% |
| Immigrants | Canada | 95.6 /100 | #112 | Exceptional 75.9% |
| Immigrants | Netherlands | 95.3 /100 | #113 | Exceptional 75.9% |
| Immigrants | Zimbabwe | 95.1 /100 | #114 | Exceptional 75.9% |
| Alaska Natives | 95.1 /100 | #115 | Exceptional 75.9% |
| Immigrants | North America | 95.0 /100 | #116 | Exceptional 75.9% |
| Assyrians/Chaldeans/Syriacs | 94.9 /100 | #117 | Exceptional 75.9% |
| Spanish Americans | 94.8 /100 | #118 | Exceptional 75.8% |
| Immigrants | Portugal | 94.8 /100 | #119 | Exceptional 75.8% |
Demographics Similar to Cubans by In Labor Force | Age 20-24
In terms of in labor force | age 20-24, the demographic groups most similar to Cubans are Armenian (72.5%, a difference of 0.070%), Iranian (72.6%, a difference of 0.090%), Native/Alaskan (72.4%, a difference of 0.090%), Ecuadorian (72.4%, a difference of 0.10%), and Immigrants from West Indies (72.4%, a difference of 0.11%).
| Demographics | Rating | Rank | In Labor Force | Age 20-24 |
| Immigrants | Argentina | 0.0 /100 | #294 | Tragic 72.8% |
| Okinawans | 0.0 /100 | #295 | Tragic 72.7% |
| Jamaicans | 0.0 /100 | #296 | Tragic 72.7% |
| Central American Indians | 0.0 /100 | #297 | Tragic 72.7% |
| Israelis | 0.0 /100 | #298 | Tragic 72.6% |
| Iranians | 0.0 /100 | #299 | Tragic 72.6% |
| Armenians | 0.0 /100 | #300 | Tragic 72.5% |
| Cubans | 0.0 /100 | #301 | Tragic 72.5% |
| Natives/Alaskans | 0.0 /100 | #302 | Tragic 72.4% |
| Ecuadorians | 0.0 /100 | #303 | Tragic 72.4% |
| Immigrants | West Indies | 0.0 /100 | #304 | Tragic 72.4% |
| Immigrants | Singapore | 0.0 /100 | #305 | Tragic 72.4% |
| Immigrants | Jamaica | 0.0 /100 | #306 | Tragic 72.4% |
| Immigrants | Ecuador | 0.0 /100 | #307 | Tragic 72.3% |
| Soviet Union | 0.0 /100 | #308 | Tragic 72.3% |