Immigrants from Senegal vs Chippewa Self-Care Disability
COMPARE
Immigrants from Senegal
Chippewa
Self-Care Disability
Self-Care Disability Comparison
Immigrants from Senegal
Chippewa
2.6%
SELF-CARE DISABILITY
1.6/ 100
METRIC RATING
237th/ 347
METRIC RANK
2.6%
SELF-CARE DISABILITY
0.2/ 100
METRIC RATING
260th/ 347
METRIC RANK
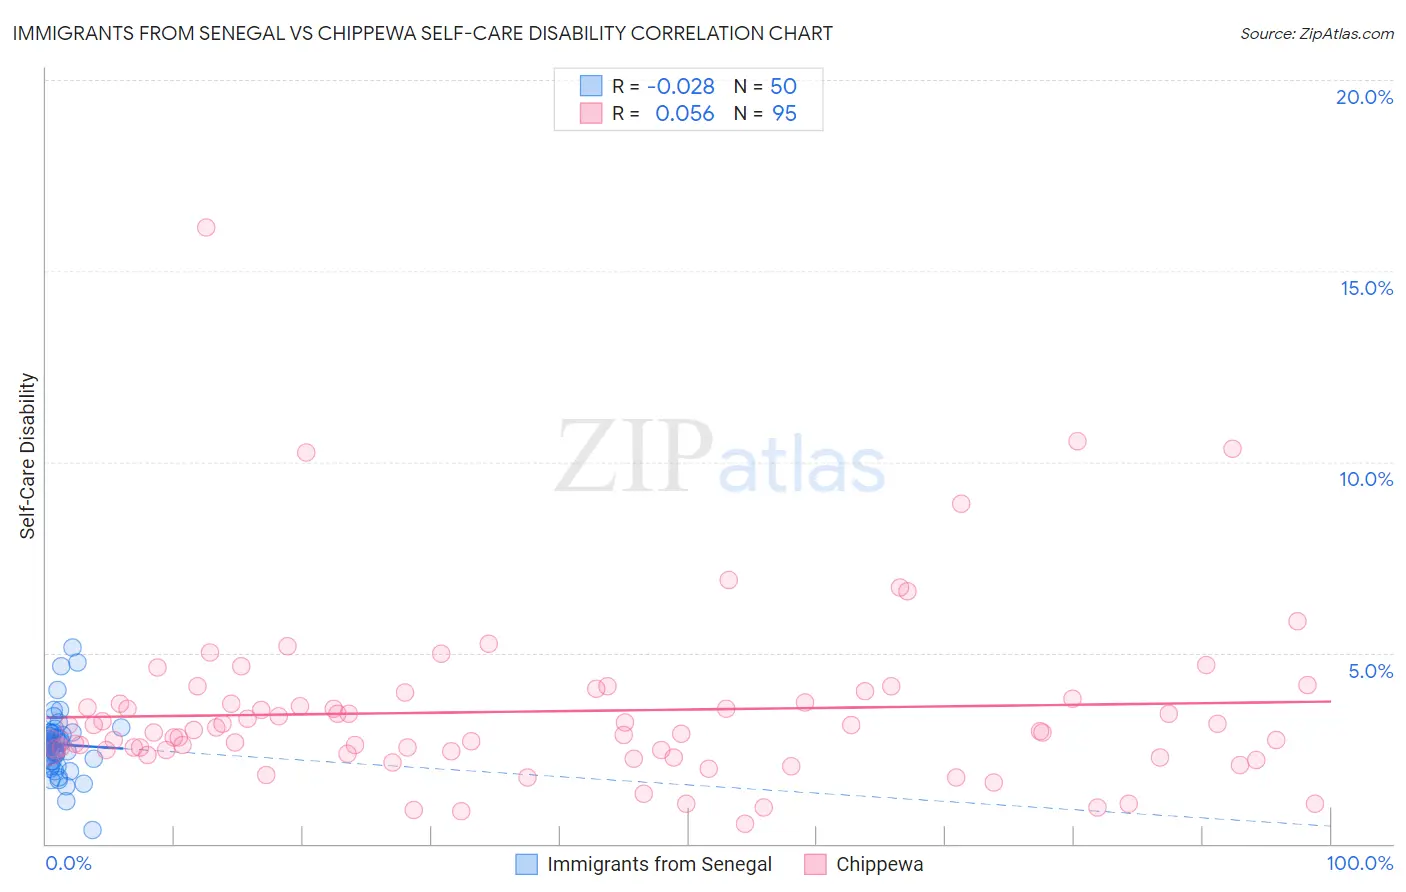
Immigrants from Senegal vs Chippewa Self-Care Disability Correlation Chart
The statistical analysis conducted on geographies consisting of 90,114,981 people shows no correlation between the proportion of Immigrants from Senegal and percentage of population with self-care disability in the United States with a correlation coefficient (R) of -0.028 and weighted average of 2.6%. Similarly, the statistical analysis conducted on geographies consisting of 214,880,520 people shows a slight positive correlation between the proportion of Chippewa and percentage of population with self-care disability in the United States with a correlation coefficient (R) of 0.056 and weighted average of 2.6%, a difference of 2.2%.
Self-Care Disability Correlation Summary
| Measurement | Immigrants from Senegal | Chippewa |
| Minimum | 0.36% | 0.52% |
| Maximum | 5.1% | 16.1% |
| Range | 4.8% | 15.6% |
| Mean | 2.6% | 3.5% |
| Median | 2.6% | 2.9% |
| Interquartile 25% (IQ1) | 2.2% | 2.4% |
| Interquartile 75% (IQ3) | 2.9% | 3.8% |
| Interquartile Range (IQR) | 0.75% | 1.4% |
| Standard Deviation (Sample) | 0.85% | 2.3% |
| Standard Deviation (Population) | 0.84% | 2.3% |
Similar Demographics by Self-Care Disability
Demographics Similar to Immigrants from Senegal by Self-Care Disability
In terms of self-care disability, the demographic groups most similar to Immigrants from Senegal are Bermudan (2.6%, a difference of 0.20%), Senegalese (2.6%, a difference of 0.26%), Bahamian (2.6%, a difference of 0.27%), Vietnamese (2.6%, a difference of 0.30%), and Liberian (2.6%, a difference of 0.31%).
| Demographics | Rating | Rank | Self-Care Disability |
| Immigrants | Ecuador | 2.5 /100 | #230 | Tragic 2.6% |
| Immigrants | Guatemala | 2.2 /100 | #231 | Tragic 2.6% |
| Albanians | 2.2 /100 | #232 | Tragic 2.6% |
| Liberians | 2.1 /100 | #233 | Tragic 2.6% |
| Vietnamese | 2.1 /100 | #234 | Tragic 2.6% |
| Bahamians | 2.0 /100 | #235 | Tragic 2.6% |
| Bermudans | 1.9 /100 | #236 | Tragic 2.6% |
| Immigrants | Senegal | 1.6 /100 | #237 | Tragic 2.6% |
| Senegalese | 1.3 /100 | #238 | Tragic 2.6% |
| Immigrants | Panama | 1.2 /100 | #239 | Tragic 2.6% |
| Marshallese | 1.2 /100 | #240 | Tragic 2.6% |
| Immigrants | Syria | 1.0 /100 | #241 | Tragic 2.6% |
| Spanish | 0.8 /100 | #242 | Tragic 2.6% |
| Hawaiians | 0.8 /100 | #243 | Tragic 2.6% |
| Yuman | 0.8 /100 | #244 | Tragic 2.6% |
Demographics Similar to Chippewa by Self-Care Disability
In terms of self-care disability, the demographic groups most similar to Chippewa are Arapaho (2.6%, a difference of 0.020%), Immigrants from Belarus (2.6%, a difference of 0.040%), Nonimmigrants (2.6%, a difference of 0.11%), Shoshone (2.7%, a difference of 0.16%), and Potawatomi (2.6%, a difference of 0.18%).
| Demographics | Rating | Rank | Self-Care Disability |
| Immigrants | Haiti | 0.3 /100 | #253 | Tragic 2.6% |
| Haitians | 0.3 /100 | #254 | Tragic 2.6% |
| Tsimshian | 0.3 /100 | #255 | Tragic 2.6% |
| Immigrants | Central America | 0.3 /100 | #256 | Tragic 2.6% |
| Potawatomi | 0.3 /100 | #257 | Tragic 2.6% |
| Immigrants | Nonimmigrants | 0.3 /100 | #258 | Tragic 2.6% |
| Immigrants | Belarus | 0.2 /100 | #259 | Tragic 2.6% |
| Chippewa | 0.2 /100 | #260 | Tragic 2.6% |
| Arapaho | 0.2 /100 | #261 | Tragic 2.6% |
| Shoshone | 0.2 /100 | #262 | Tragic 2.7% |
| Immigrants | Latin America | 0.2 /100 | #263 | Tragic 2.7% |
| Immigrants | Iran | 0.2 /100 | #264 | Tragic 2.7% |
| Immigrants | Nicaragua | 0.2 /100 | #265 | Tragic 2.7% |
| Immigrants | Cambodia | 0.1 /100 | #266 | Tragic 2.7% |
| Yaqui | 0.1 /100 | #267 | Tragic 2.7% |