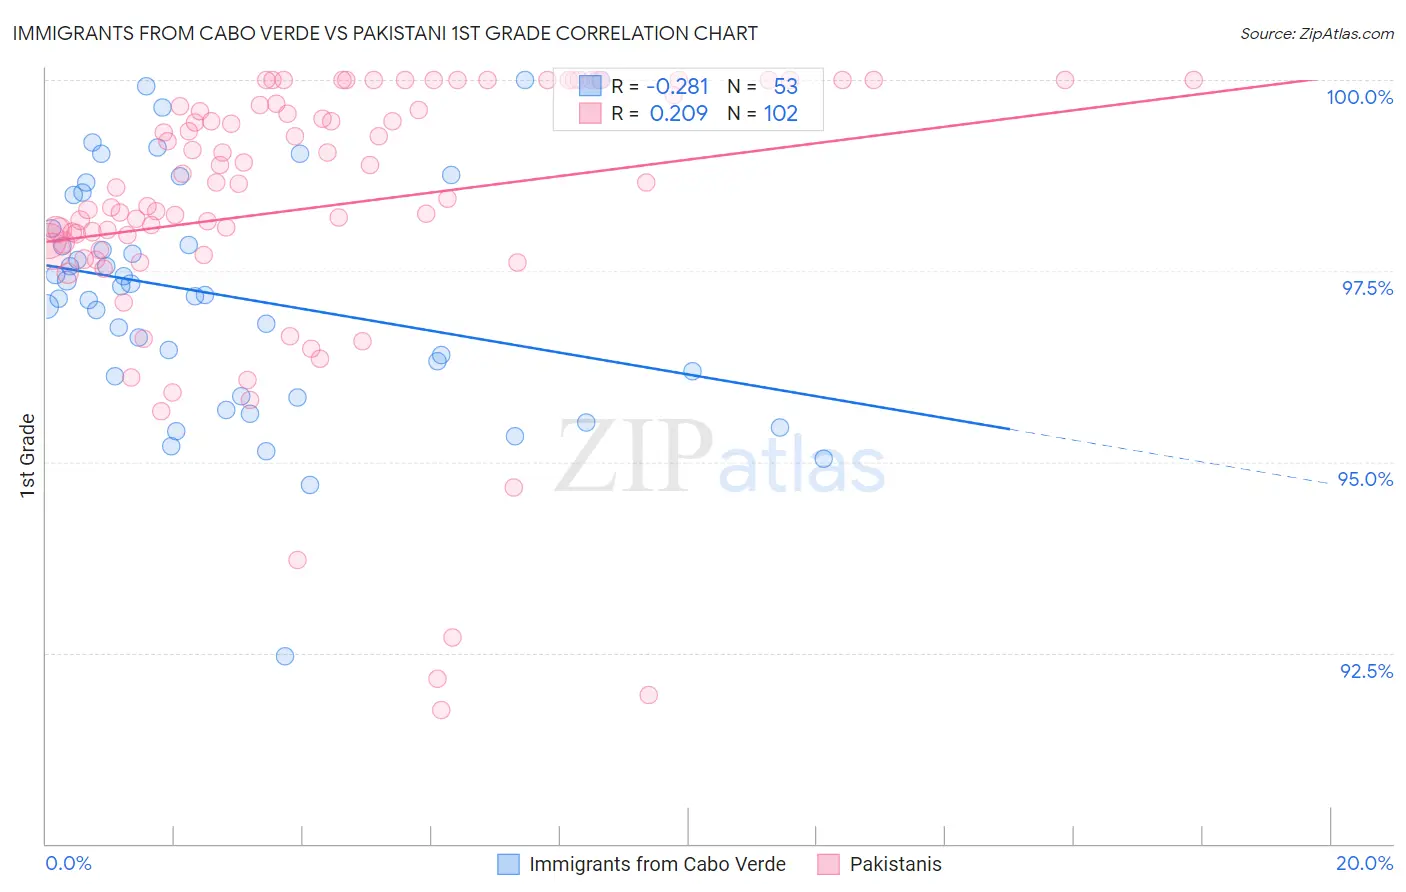
Immigrants from Cabo Verde vs Pakistani 1st Grade
COMPARE
Immigrants from Cabo Verde
Pakistani
1st Grade
1st Grade Comparison
Immigrants from Cabo Verde
Pakistanis
96.3%
1ST GRADE
0.0/ 100
METRIC RATING
340th/ 347
METRIC RANK
97.9%
1ST GRADE
35.8/ 100
METRIC RATING
187th/ 347
METRIC RANK
Immigrants from Cabo Verde vs Pakistani 1st Grade Correlation Chart
The statistical analysis conducted on geographies consisting of 38,158,666 people shows a weak negative correlation between the proportion of Immigrants from Cabo Verde and percentage of population with at least 1st grade education in the United States with a correlation coefficient (R) of -0.281 and weighted average of 96.3%. Similarly, the statistical analysis conducted on geographies consisting of 335,355,426 people shows a weak positive correlation between the proportion of Pakistanis and percentage of population with at least 1st grade education in the United States with a correlation coefficient (R) of 0.209 and weighted average of 97.9%, a difference of 1.6%.
1st Grade Correlation Summary
| Measurement | Immigrants from Cabo Verde | Pakistani |
| Minimum | 92.5% | 91.8% |
| Maximum | 100.0% | 100.0% |
| Range | 7.5% | 8.2% |
| Mean | 97.2% | 98.3% |
| Median | 97.2% | 98.6% |
| Interquartile 25% (IQ1) | 96.0% | 97.8% |
| Interquartile 75% (IQ3) | 98.3% | 99.7% |
| Interquartile Range (IQR) | 2.3% | 1.9% |
| Standard Deviation (Sample) | 1.5% | 1.8% |
| Standard Deviation (Population) | 1.5% | 1.8% |
Similar Demographics by 1st Grade
Demographics Similar to Immigrants from Cabo Verde by 1st Grade
In terms of 1st grade, the demographic groups most similar to Immigrants from Cabo Verde are Immigrants from Guatemala (96.4%, a difference of 0.020%), Immigrants from Central America (96.3%, a difference of 0.020%), Immigrants from Mexico (96.3%, a difference of 0.050%), Salvadoran (96.3%, a difference of 0.080%), and Immigrants from Fiji (96.4%, a difference of 0.090%).
| Demographics | Rating | Rank | 1st Grade |
| Immigrants | Dominican Republic | 0.0 /100 | #333 | Tragic 96.5% |
| Bangladeshis | 0.0 /100 | #334 | Tragic 96.5% |
| Yakama | 0.0 /100 | #335 | Tragic 96.5% |
| Guatemalans | 0.0 /100 | #336 | Tragic 96.5% |
| Immigrants | Cambodia | 0.0 /100 | #337 | Tragic 96.5% |
| Immigrants | Fiji | 0.0 /100 | #338 | Tragic 96.4% |
| Immigrants | Guatemala | 0.0 /100 | #339 | Tragic 96.4% |
| Immigrants | Cabo Verde | 0.0 /100 | #340 | Tragic 96.3% |
| Immigrants | Central America | 0.0 /100 | #341 | Tragic 96.3% |
| Immigrants | Mexico | 0.0 /100 | #342 | Tragic 96.3% |
| Salvadorans | 0.0 /100 | #343 | Tragic 96.3% |
| Nepalese | 0.0 /100 | #344 | Tragic 96.1% |
| Immigrants | El Salvador | 0.0 /100 | #345 | Tragic 96.1% |
| Immigrants | Yemen | 0.0 /100 | #346 | Tragic 95.8% |
| Spanish American Indians | 0.0 /100 | #347 | Tragic 95.7% |
Demographics Similar to Pakistanis by 1st Grade
In terms of 1st grade, the demographic groups most similar to Pakistanis are Paiute (97.9%, a difference of 0.0%), Arab (97.9%, a difference of 0.0%), Immigrants from Kazakhstan (97.9%, a difference of 0.0%), Immigrants from Poland (97.9%, a difference of 0.010%), and Immigrants from Belarus (97.9%, a difference of 0.010%).
| Demographics | Rating | Rank | 1st Grade |
| Immigrants | Bosnia and Herzegovina | 46.6 /100 | #180 | Average 97.9% |
| Portuguese | 44.2 /100 | #181 | Average 97.9% |
| Egyptians | 42.7 /100 | #182 | Average 97.9% |
| Immigrants | Argentina | 41.3 /100 | #183 | Average 97.9% |
| Immigrants | Poland | 40.1 /100 | #184 | Average 97.9% |
| Immigrants | Belarus | 39.3 /100 | #185 | Fair 97.9% |
| Paiute | 36.5 /100 | #186 | Fair 97.9% |
| Pakistanis | 35.8 /100 | #187 | Fair 97.9% |
| Arabs | 35.5 /100 | #188 | Fair 97.9% |
| Immigrants | Kazakhstan | 34.9 /100 | #189 | Fair 97.9% |
| Panamanians | 34.1 /100 | #190 | Fair 97.9% |
| Blacks/African Americans | 30.7 /100 | #191 | Fair 97.9% |
| Paraguayans | 30.2 /100 | #192 | Fair 97.9% |
| Immigrants | Taiwan | 29.4 /100 | #193 | Fair 97.9% |
| Mongolians | 29.2 /100 | #194 | Fair 97.9% |