Immigrants from Burma/Myanmar vs Basque Births to Unmarried Women

COMPARE

Immigrants from Burma/Myanmar
Race
Ancestry
AfghanAfricanAlaska NativeAlaskan AthabascanAlbanianAleutAlsatianAmericanApacheArabArapahoArgentineanArmenianAssyrian/Chaldean/SyriacAustralianAustrianBahamianBangladeshiBarbadianBelgianBelizeanBermudanBhutaneseBlackfeetBolivianBrazilianBritishBritish West IndianBulgarianBurmeseCajunCambodianCanadianCape VerdeanCarpatho RusynCelticCentral AmericanCentral American IndianCherokeeCheyenneChickasawChileanChineseChippewaChoctawColombianColvilleComancheCosta RicanCreeCreekCroatianCrowCubanCypriotCzechCzechoslovakianDanishDelawareDominicanDutchDutch West IndianEastern EuropeanEcuadorianEgyptianEnglishEstonianEthiopianEuropeanFijianFilipinoFinnishFrenchFrench American IndianFrench CanadianGermanGerman RussianGhanaianGreekGuamanian/ChamorroGuatemalanGuyaneseHaitianHmongHonduranHopiHoumaHungarianIcelanderIndian (Asian)IndonesianInupiatIranianIraqiIrishIroquoisIsraeliItalianJamaicanJapaneseJordanianKenyanKiowaKoreanLaotianLatvianLebaneseLiberianLithuanianLumbeeLuxembourgerMacedonianMalaysianMalteseMarshalleseMenomineeMexicanMexican American IndianMongolianMoroccanNative HawaiianNavajoNepaleseNew ZealanderNicaraguanNigerianNorthern EuropeanNorwegianOkinawanOsageOttawaPaiutePakistaniPalestinianPanamanianParaguayanPennsylvania GermanPeruvianPimaPolishPortuguesePotawatomiPuebloPuerto RicanPuget Sound SalishRomanianRussianSalvadoranSamoanScandinavianScotch-IrishScottishSeminoleSenegaleseSerbianShoshoneSierra LeoneanSiouxSlavicSlovakSloveneSomaliSouth AfricanSouth AmericanSouth American IndianSoviet UnionSpaniardSpanishSpanish AmericanSpanish American IndianSri LankanSubsaharan AfricanSudaneseSwedishSwissSyrianTaiwaneseThaiTlingit-HaidaTohono O'OdhamTonganTrinidadian and TobagonianTsimshianTurkishU.S. Virgin IslanderUgandanUkrainianUruguayanUteVenezuelanVietnameseWelshWest IndianYakamaYaquiYugoslavianYumanYup'ikZimbabwean
Immigration
NonimmigrantsImmigrantsAfghanistanAfricaAlbaniaArgentinaArmeniaAsiaAustraliaAustriaBahamasBangladeshBarbadosBelarusBelgiumBelizeBoliviaBosnia and HerzegovinaBrazilBulgariaBurma/MyanmarCabo VerdeCambodiaCameroonCanadaCaribbeanCentral AmericaChileChinaColombiaCongoCosta RicaCroatiaCubaCzechoslovakiaDenmarkDominicaDominican RepublicEastern AfricaEastern AsiaEastern EuropeEcuadorEgyptEl SalvadorEnglandEritreaEthiopiaEuropeFijiFranceGermanyGhanaGreeceGrenadaGuatemalaGuyanaHaitiHondurasHong KongHungaryIndiaIndonesiaIranIraqIrelandIsraelItalyJamaicaJapanJordanKazakhstanKenyaKoreaKuwaitLaosLatin AmericaLatviaLebanonLiberiaLithuaniaMalaysiaMexicoMicronesiaMiddle AfricaMoldovaMoroccoNepalNetherlandsNicaraguaNigeriaNorth AmericaNorth MacedoniaNorthern AfricaNorthern EuropeNorwayOceaniaPakistanPanamaPeruPhilippinesPolandPortugalRomaniaRussiaSaudi ArabiaScotlandSenegalSerbiaSierra LeoneSingaporeSomaliaSouth AfricaSouth AmericaSouth Central AsiaSouth Eastern AsiaSouthern EuropeSpainSri LankaSt. Vincent and the GrenadinesSudanSwedenSwitzerlandSyriaTaiwanThailandTrinidad and TobagoTurkeyUgandaUkraineUruguayUzbekistanVenezuelaVietnamWest IndiesWestern AfricaWestern AsiaWestern EuropeYemenZaireZimbabweAzores
Basque
Race
Ancestry
AfghanAfricanAlaska NativeAlaskan AthabascanAlbanianAleutAlsatianAmericanApacheArabArapahoArgentineanArmenianAssyrian/Chaldean/SyriacAustralianAustrianBahamianBangladeshiBarbadianBasqueBelgianBelizeanBermudanBhutaneseBlackfeetBolivianBrazilianBritishBritish West IndianBulgarianBurmeseCajunCambodianCanadianCape VerdeanCarpatho RusynCelticCentral AmericanCentral American IndianCherokeeCheyenneChickasawChileanChineseChippewaChoctawColombianColvilleComancheCosta RicanCreeCreekCroatianCrowCubanCypriotCzechCzechoslovakianDanishDelawareDominicanDutchDutch West IndianEastern EuropeanEcuadorianEgyptianEnglishEstonianEthiopianEuropeanFijianFilipinoFinnishFrenchFrench American IndianFrench CanadianGermanGerman RussianGhanaianGreekGuamanian/ChamorroGuatemalanGuyaneseHaitianHmongHonduranHopiHoumaHungarianIcelanderIndian (Asian)IndonesianInupiatIranianIraqiIrishIroquoisIsraeliItalianJamaicanJapaneseJordanianKenyanKiowaKoreanLaotianLatvianLebaneseLiberianLithuanianLumbeeLuxembourgerMacedonianMalaysianMalteseMarshalleseMenomineeMexicanMexican American IndianMongolianMoroccanNative HawaiianNavajoNepaleseNew ZealanderNicaraguanNigerianNorthern EuropeanNorwegianOkinawanOsageOttawaPaiutePakistaniPalestinianPanamanianParaguayanPennsylvania GermanPeruvianPimaPolishPortuguesePotawatomiPuebloPuerto RicanPuget Sound SalishRomanianRussianSalvadoranSamoanScandinavianScotch-IrishScottishSeminoleSenegaleseSerbianShoshoneSierra LeoneanSiouxSlavicSlovakSloveneSomaliSouth AfricanSouth AmericanSouth American IndianSoviet UnionSpaniardSpanishSpanish AmericanSpanish American IndianSri LankanSubsaharan AfricanSudaneseSwedishSwissSyrianTaiwaneseThaiTlingit-HaidaTohono O'OdhamTonganTrinidadian and TobagonianTsimshianTurkishU.S. Virgin IslanderUgandanUkrainianUruguayanUteVenezuelanVietnameseWelshWest IndianYakamaYaquiYugoslavianYumanYup'ikZimbabwean
Immigration
NonimmigrantsImmigrantsAfghanistanAfricaAlbaniaArgentinaArmeniaAsiaAustraliaAustriaBahamasBangladeshBarbadosBelarusBelgiumBelizeBoliviaBosnia and HerzegovinaBrazilBulgariaCabo VerdeCambodiaCameroonCanadaCaribbeanCentral AmericaChileChinaColombiaCongoCosta RicaCroatiaCubaCzechoslovakiaDenmarkDominicaDominican RepublicEastern AfricaEastern AsiaEastern EuropeEcuadorEgyptEl SalvadorEnglandEritreaEthiopiaEuropeFijiFranceGermanyGhanaGreeceGrenadaGuatemalaGuyanaHaitiHondurasHong KongHungaryIndiaIndonesiaIranIraqIrelandIsraelItalyJamaicaJapanJordanKazakhstanKenyaKoreaKuwaitLaosLatin AmericaLatviaLebanonLiberiaLithuaniaMalaysiaMexicoMicronesiaMiddle AfricaMoldovaMoroccoNepalNetherlandsNicaraguaNigeriaNorth AmericaNorth MacedoniaNorthern AfricaNorthern EuropeNorwayOceaniaPakistanPanamaPeruPhilippinesPolandPortugalRomaniaRussiaSaudi ArabiaScotlandSenegalSerbiaSierra LeoneSingaporeSomaliaSouth AfricaSouth AmericaSouth Central AsiaSouth Eastern AsiaSouthern EuropeSpainSri LankaSt. Vincent and the GrenadinesSudanSwedenSwitzerlandSyriaTaiwanThailandTrinidad and TobagoTurkeyUgandaUkraineUruguayUzbekistanVenezuelaVietnamWest IndiesWestern AfricaWestern AsiaWestern EuropeYemenZaireZimbabweAzores
Births to Unmarried Women
Income
Poverty
Unemployment
Labor Participation
Family Structure
Vehicle Availability
Education Level
Disability

Births to Unmarried Women Comparison

Immigrants from Burma/Myanmar

Basques

Poor
Exceptional
32.9%
BIRTHS TO UNMARRIED WOMEN
16.7/ 100
METRIC RATING
201st/ 347
METRIC RANK
29.7%
BIRTHS TO UNMARRIED WOMEN
93.0/ 100
METRIC RATING
112th/ 347
METRIC RANK

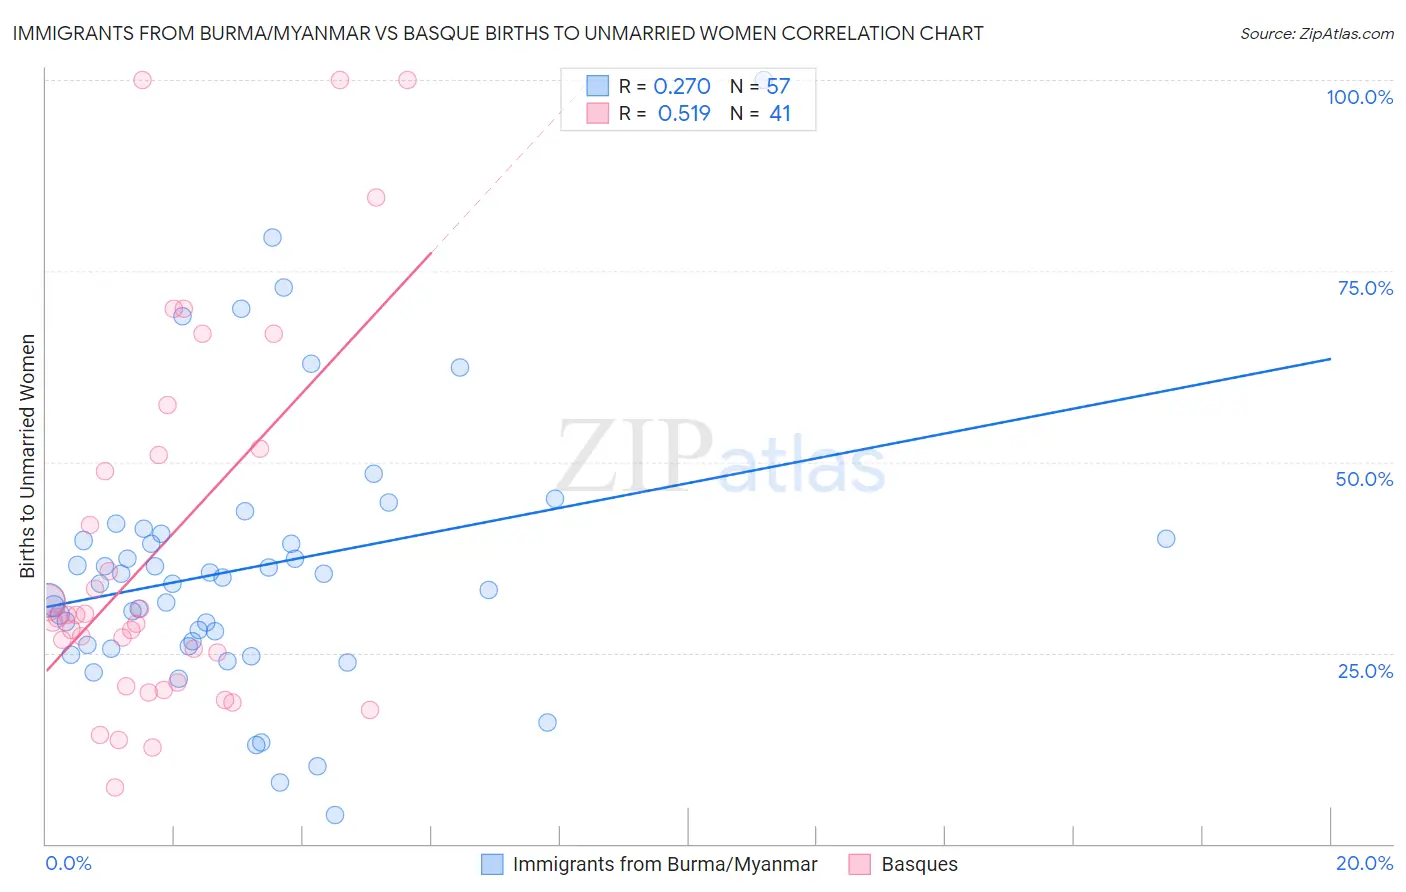
Immigrants from Burma/Myanmar vs Basque Births to Unmarried Women Correlation Chart

The statistical analysis conducted on geographies consisting of 166,895,809 people shows a weak positive correlation between the proportion of Immigrants from Burma/Myanmar and percentage of births to unmarried women in the United States with a correlation coefficient (R) of 0.270 and weighted average of 32.9%. Similarly, the statistical analysis conducted on geographies consisting of 159,478,325 people shows a substantial positive correlation between the proportion of Basques and percentage of births to unmarried women in the United States with a correlation coefficient (R) of 0.519 and weighted average of 29.7%, a difference of 10.5%.
Immigrants from Burma/Myanmar vs Basque Births to Unmarried Women

Births to Unmarried Women Correlation Summary

MeasurementImmigrants from Burma/MyanmarBasque
Minimum3.8%7.4%
Maximum100.0%100.0%
Range96.2%92.6%
Mean36.0%38.8%
Median34.0%29.6%
Interquartile 25% (IQ1)25.9%20.9%
Interquartile 75% (IQ3)40.3%51.3%
Interquartile Range (IQR)14.4%30.5%
Standard Deviation (Sample)17.5%24.9%
Standard Deviation (Population)17.4%24.6%

Similar Demographics by Births to Unmarried Women

Demographics Similar to Immigrants from Burma/Myanmar by Births to Unmarried Women

In terms of births to unmarried women, the demographic groups most similar to Immigrants from Burma/Myanmar are Immigrants from Micronesia (32.9%, a difference of 0.010%), Immigrants from Germany (32.8%, a difference of 0.33%), Immigrants from Thailand (32.8%, a difference of 0.34%), Ute (33.0%, a difference of 0.39%), and Immigrants from Africa (33.0%, a difference of 0.41%).
DemographicsRating | RankBirths to Unmarried Women
Sudanese
27.3
/100
|
#194
Fair
32.4%
Samoans
21.9
/100
|
#195
Fair
32.6%
Immigrants | Colombia
21.7
/100
|
#196
Fair
32.6%
Immigrants | Immigrants
20.6
/100
|
#197
Fair
32.7%
Costa Ricans
20.3
/100
|
#198
Fair
32.7%
Immigrants | Thailand
18.9
/100
|
#199
Poor
32.8%
Immigrants | Germany
18.8
/100
|
#200
Poor
32.8%
Immigrants | Burma/Myanmar
16.7
/100
|
#201
Poor
32.9%
Immigrants | Micronesia
16.6
/100
|
#202
Poor
32.9%
Ute
14.4
/100
|
#203
Poor
33.0%
Immigrants | Africa
14.3
/100
|
#204
Poor
33.0%
German Russians
13.1
/100
|
#205
Poor
33.1%
Uruguayans
12.8
/100
|
#206
Poor
33.1%
Immigrants | Sudan
11.5
/100
|
#207
Poor
33.2%
Hawaiians
11.3
/100
|
#208
Poor
33.2%

Demographics Similar to Basques by Births to Unmarried Women

In terms of births to unmarried women, the demographic groups most similar to Basques are Immigrants from Hungary (29.7%, a difference of 0.010%), Scandinavian (29.8%, a difference of 0.10%), Immigrants from Ethiopia (29.7%, a difference of 0.15%), Immigrants from Croatia (29.8%, a difference of 0.16%), and Greek (29.7%, a difference of 0.18%).
DemographicsRating | RankBirths to Unmarried Women
Immigrants | Nepal
94.3
/100
|
#105
Exceptional
29.6%
Swedes
93.8
/100
|
#106
Exceptional
29.6%
Immigrants | Brazil
93.7
/100
|
#107
Exceptional
29.6%
Paraguayans
93.5
/100
|
#108
Exceptional
29.7%
Greeks
93.4
/100
|
#109
Exceptional
29.7%
Immigrants | Ethiopia
93.4
/100
|
#110
Exceptional
29.7%
Immigrants | Hungary
93.0
/100
|
#111
Exceptional
29.7%
Basques
93.0
/100
|
#112
Exceptional
29.7%
Scandinavians
92.7
/100
|
#113
Exceptional
29.8%
Immigrants | Croatia
92.6
/100
|
#114
Exceptional
29.8%
Ethiopians
91.9
/100
|
#115
Exceptional
29.8%
Immigrants | Italy
91.7
/100
|
#116
Exceptional
29.9%
Immigrants | Netherlands
91.1
/100
|
#117
Exceptional
29.9%
Immigrants | Norway
91.0
/100
|
#118
Exceptional
29.9%
Argentineans
90.5
/100
|
#119
Exceptional
30.0%