Immigrants from Bulgaria vs Immigrants from Latin America Female Unemployment
COMPARE
Immigrants from Bulgaria
Immigrants from Latin America
Female Unemployment
Female Unemployment Comparison
Immigrants from Bulgaria
Immigrants from Latin America
4.9%
FEMALE UNEMPLOYMENT
99.3/ 100
METRIC RATING
46th/ 347
METRIC RANK
6.1%
FEMALE UNEMPLOYMENT
0.0/ 100
METRIC RATING
295th/ 347
METRIC RANK
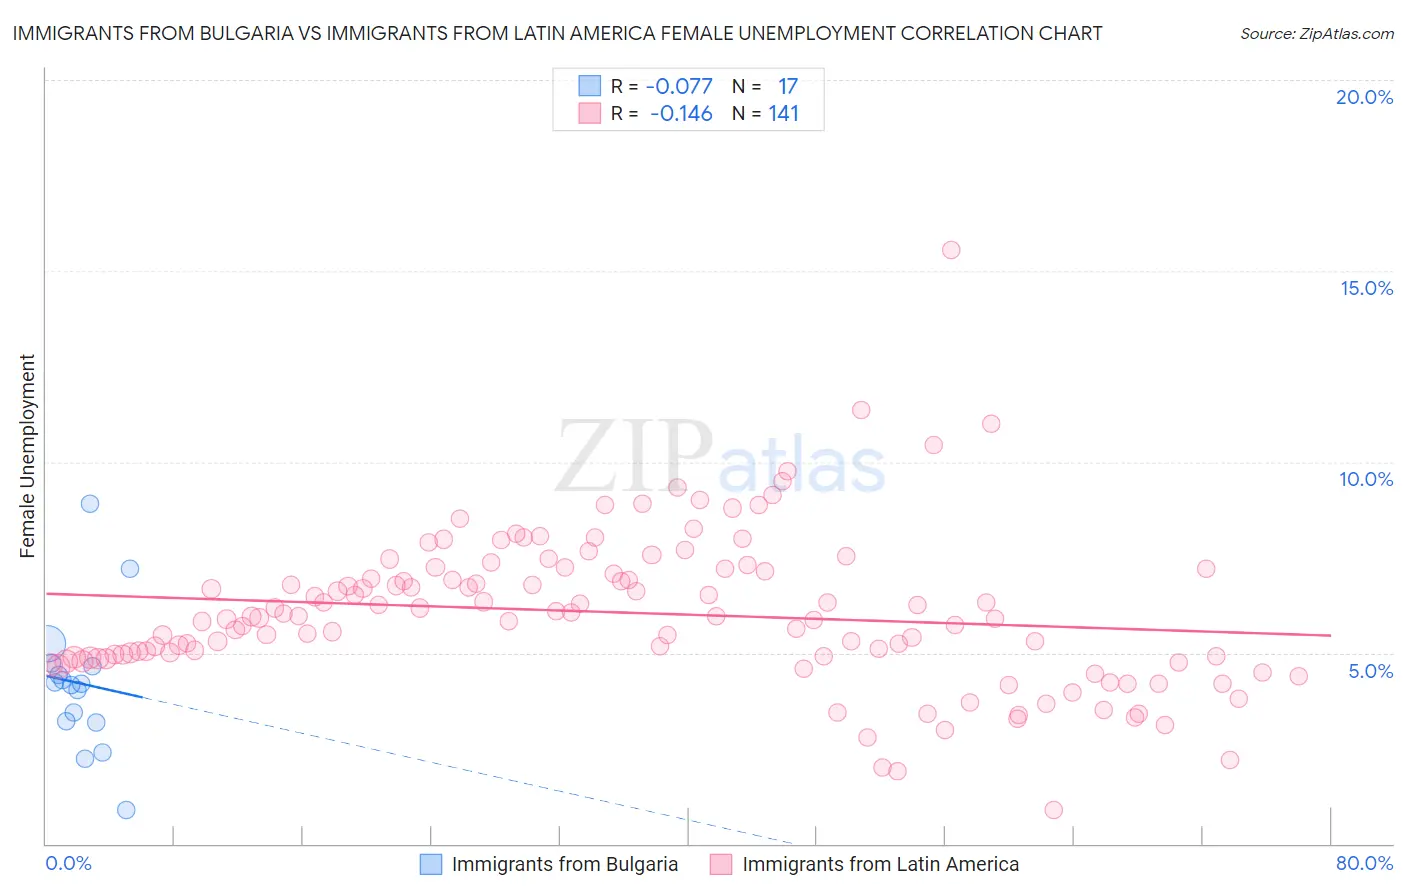
Immigrants from Bulgaria vs Immigrants from Latin America Female Unemployment Correlation Chart
The statistical analysis conducted on geographies consisting of 172,394,252 people shows a slight negative correlation between the proportion of Immigrants from Bulgaria and unemploymnet rate among females in the United States with a correlation coefficient (R) of -0.077 and weighted average of 4.9%. Similarly, the statistical analysis conducted on geographies consisting of 548,551,926 people shows a poor negative correlation between the proportion of Immigrants from Latin America and unemploymnet rate among females in the United States with a correlation coefficient (R) of -0.146 and weighted average of 6.1%, a difference of 25.9%.
Female Unemployment Correlation Summary
| Measurement | Immigrants from Bulgaria | Immigrants from Latin America |
| Minimum | 0.90% | 0.90% |
| Maximum | 8.9% | 15.5% |
| Range | 8.0% | 14.6% |
| Mean | 4.2% | 6.1% |
| Median | 4.2% | 6.0% |
| Interquartile 25% (IQ1) | 3.2% | 4.9% |
| Interquartile 75% (IQ3) | 4.7% | 7.2% |
| Interquartile Range (IQR) | 1.5% | 2.3% |
| Standard Deviation (Sample) | 1.8% | 2.0% |
| Standard Deviation (Population) | 1.8% | 2.0% |
Similar Demographics by Female Unemployment
Demographics Similar to Immigrants from Bulgaria by Female Unemployment
In terms of female unemployment, the demographic groups most similar to Immigrants from Bulgaria are Austrian (4.9%, a difference of 0.030%), Okinawan (4.9%, a difference of 0.080%), Greek (4.9%, a difference of 0.10%), Eastern European (4.9%, a difference of 0.21%), and Thai (4.9%, a difference of 0.29%).
| Demographics | Rating | Rank | Female Unemployment |
| Scotch-Irish | 99.6 /100 | #39 | Exceptional 4.8% |
| French | 99.6 /100 | #40 | Exceptional 4.8% |
| Tongans | 99.5 /100 | #41 | Exceptional 4.8% |
| Italians | 99.5 /100 | #42 | Exceptional 4.8% |
| Eastern Europeans | 99.4 /100 | #43 | Exceptional 4.9% |
| Greeks | 99.4 /100 | #44 | Exceptional 4.9% |
| Austrians | 99.3 /100 | #45 | Exceptional 4.9% |
| Immigrants | Bulgaria | 99.3 /100 | #46 | Exceptional 4.9% |
| Okinawans | 99.3 /100 | #47 | Exceptional 4.9% |
| Thais | 99.2 /100 | #48 | Exceptional 4.9% |
| Australians | 99.2 /100 | #49 | Exceptional 4.9% |
| Immigrants | Cuba | 99.1 /100 | #50 | Exceptional 4.9% |
| Cambodians | 99.1 /100 | #51 | Exceptional 4.9% |
| Slavs | 99.1 /100 | #52 | Exceptional 4.9% |
| Whites/Caucasians | 99.0 /100 | #53 | Exceptional 4.9% |
Demographics Similar to Immigrants from Latin America by Female Unemployment
In terms of female unemployment, the demographic groups most similar to Immigrants from Latin America are Alaskan Athabascan (6.1%, a difference of 0.020%), West Indian (6.1%, a difference of 0.030%), Jamaican (6.1%, a difference of 0.050%), Immigrants from El Salvador (6.1%, a difference of 0.10%), and Ute (6.1%, a difference of 0.16%).
| Demographics | Rating | Rank | Female Unemployment |
| Haitians | 0.0 /100 | #288 | Tragic 6.1% |
| Trinidadians and Tobagonians | 0.0 /100 | #289 | Tragic 6.1% |
| Immigrants | Caribbean | 0.0 /100 | #290 | Tragic 6.1% |
| Immigrants | West Indies | 0.0 /100 | #291 | Tragic 6.1% |
| Immigrants | Trinidad and Tobago | 0.0 /100 | #292 | Tragic 6.1% |
| Mexicans | 0.0 /100 | #293 | Tragic 6.1% |
| Immigrants | El Salvador | 0.0 /100 | #294 | Tragic 6.1% |
| Immigrants | Latin America | 0.0 /100 | #295 | Tragic 6.1% |
| Alaskan Athabascans | 0.0 /100 | #296 | Tragic 6.1% |
| West Indians | 0.0 /100 | #297 | Tragic 6.1% |
| Jamaicans | 0.0 /100 | #298 | Tragic 6.1% |
| Ute | 0.0 /100 | #299 | Tragic 6.1% |
| Immigrants | Haiti | 0.0 /100 | #300 | Tragic 6.1% |
| Immigrants | Barbados | 0.0 /100 | #301 | Tragic 6.2% |
| U.S. Virgin Islanders | 0.0 /100 | #302 | Tragic 6.2% |