Immigrants from Bulgaria vs Lebanese Disability Age 5 to 17
COMPARE
Immigrants from Bulgaria
Lebanese
Disability Age 5 to 17
Disability Age 5 to 17 Comparison
Immigrants from Bulgaria
Lebanese
5.4%
DISABILITY AGE 5 TO 17
94.0/ 100
METRIC RATING
130th/ 347
METRIC RANK
5.6%
DISABILITY AGE 5 TO 17
61.4/ 100
METRIC RATING
165th/ 347
METRIC RANK
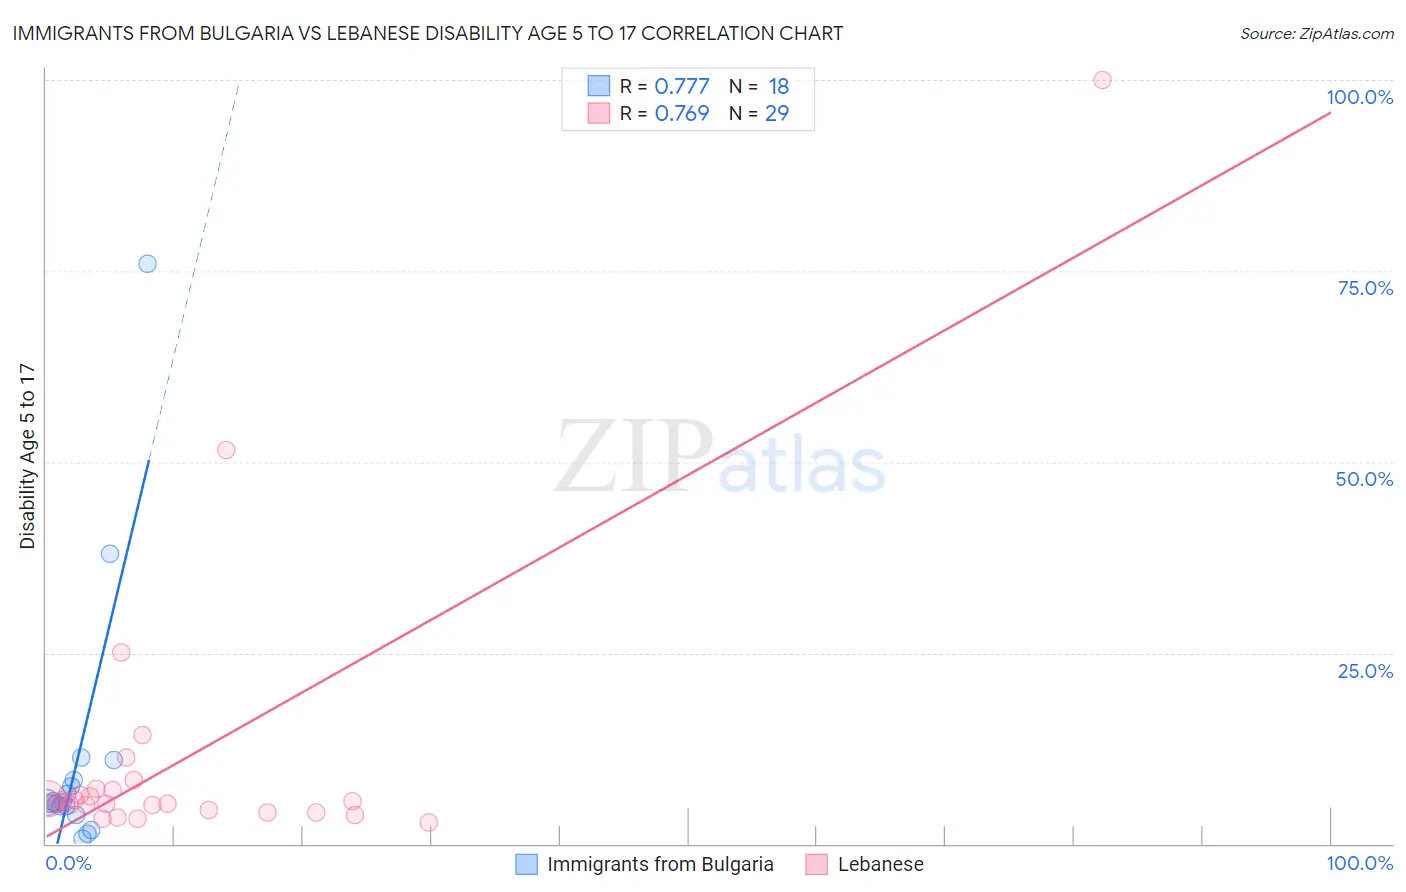
Immigrants from Bulgaria vs Lebanese Disability Age 5 to 17 Correlation Chart
The statistical analysis conducted on geographies consisting of 171,828,354 people shows a strong positive correlation between the proportion of Immigrants from Bulgaria and percentage of population with a disability between the ages 5 and 17 in the United States with a correlation coefficient (R) of 0.777 and weighted average of 5.4%. Similarly, the statistical analysis conducted on geographies consisting of 398,034,375 people shows a strong positive correlation between the proportion of Lebanese and percentage of population with a disability between the ages 5 and 17 in the United States with a correlation coefficient (R) of 0.769 and weighted average of 5.6%, a difference of 2.9%.
Disability Age 5 to 17 Correlation Summary
| Measurement | Immigrants from Bulgaria | Lebanese |
| Minimum | 0.67% | 2.9% |
| Maximum | 76.0% | 100.0% |
| Range | 75.3% | 97.1% |
| Mean | 11.3% | 11.2% |
| Median | 5.4% | 5.4% |
| Interquartile 25% (IQ1) | 4.8% | 4.3% |
| Interquartile 75% (IQ3) | 8.4% | 7.1% |
| Interquartile Range (IQR) | 3.6% | 2.8% |
| Standard Deviation (Sample) | 18.1% | 19.5% |
| Standard Deviation (Population) | 17.6% | 19.1% |
Similar Demographics by Disability Age 5 to 17
Demographics Similar to Immigrants from Bulgaria by Disability Age 5 to 17
In terms of disability age 5 to 17, the demographic groups most similar to Immigrants from Bulgaria are Romanian (5.4%, a difference of 0.020%), Immigrants from Venezuela (5.4%, a difference of 0.11%), New Zealander (5.4%, a difference of 0.23%), Latvian (5.4%, a difference of 0.23%), and Arab (5.4%, a difference of 0.23%).
| Demographics | Rating | Rank | Disability Age 5 to 17 |
| Immigrants | Ethiopia | 95.5 /100 | #123 | Exceptional 5.4% |
| Crow | 95.0 /100 | #124 | Exceptional 5.4% |
| Immigrants | Chile | 95.0 /100 | #125 | Exceptional 5.4% |
| New Zealanders | 95.0 /100 | #126 | Exceptional 5.4% |
| Latvians | 95.0 /100 | #127 | Exceptional 5.4% |
| Immigrants | Venezuela | 94.5 /100 | #128 | Exceptional 5.4% |
| Romanians | 94.1 /100 | #129 | Exceptional 5.4% |
| Immigrants | Bulgaria | 94.0 /100 | #130 | Exceptional 5.4% |
| Arabs | 92.9 /100 | #131 | Exceptional 5.4% |
| Immigrants | Colombia | 92.9 /100 | #132 | Exceptional 5.4% |
| Venezuelans | 92.7 /100 | #133 | Exceptional 5.4% |
| Yuman | 92.3 /100 | #134 | Exceptional 5.4% |
| Immigrants | Belize | 91.7 /100 | #135 | Exceptional 5.4% |
| Immigrants | Denmark | 91.4 /100 | #136 | Exceptional 5.4% |
| Navajo | 90.9 /100 | #137 | Exceptional 5.4% |
Demographics Similar to Lebanese by Disability Age 5 to 17
In terms of disability age 5 to 17, the demographic groups most similar to Lebanese are Immigrants from Scotland (5.6%, a difference of 0.030%), Greek (5.6%, a difference of 0.040%), Immigrants from Burma/Myanmar (5.6%, a difference of 0.11%), Immigrants from Southern Europe (5.6%, a difference of 0.14%), and Iraqi (5.6%, a difference of 0.27%).
| Demographics | Rating | Rank | Disability Age 5 to 17 |
| Immigrants | Nepal | 77.1 /100 | #158 | Good 5.5% |
| Immigrants | Zimbabwe | 75.3 /100 | #159 | Good 5.5% |
| South Africans | 73.3 /100 | #160 | Good 5.5% |
| Immigrants | Saudi Arabia | 69.1 /100 | #161 | Good 5.5% |
| Zimbabweans | 67.2 /100 | #162 | Good 5.5% |
| Immigrants | Southern Europe | 64.0 /100 | #163 | Good 5.6% |
| Immigrants | Scotland | 61.9 /100 | #164 | Good 5.6% |
| Lebanese | 61.4 /100 | #165 | Good 5.6% |
| Greeks | 60.6 /100 | #166 | Good 5.6% |
| Immigrants | Burma/Myanmar | 59.3 /100 | #167 | Average 5.6% |
| Iraqis | 56.0 /100 | #168 | Average 5.6% |
| Immigrants | Norway | 55.7 /100 | #169 | Average 5.6% |
| Serbians | 54.0 /100 | #170 | Average 5.6% |
| Immigrants | Iraq | 53.9 /100 | #171 | Average 5.6% |
| Ukrainians | 51.5 /100 | #172 | Average 5.6% |