Immigrants from Bosnia and Herzegovina vs Immigrants from Cambodia Disability
COMPARE
Immigrants from Bosnia and Herzegovina
Immigrants from Cambodia
Disability
Disability Comparison
Immigrants from Bosnia and Herzegovina
Immigrants from Cambodia
11.9%
DISABILITY
18.0/ 100
METRIC RATING
193rd/ 347
METRIC RANK
12.0%
DISABILITY
7.3/ 100
METRIC RATING
211th/ 347
METRIC RANK
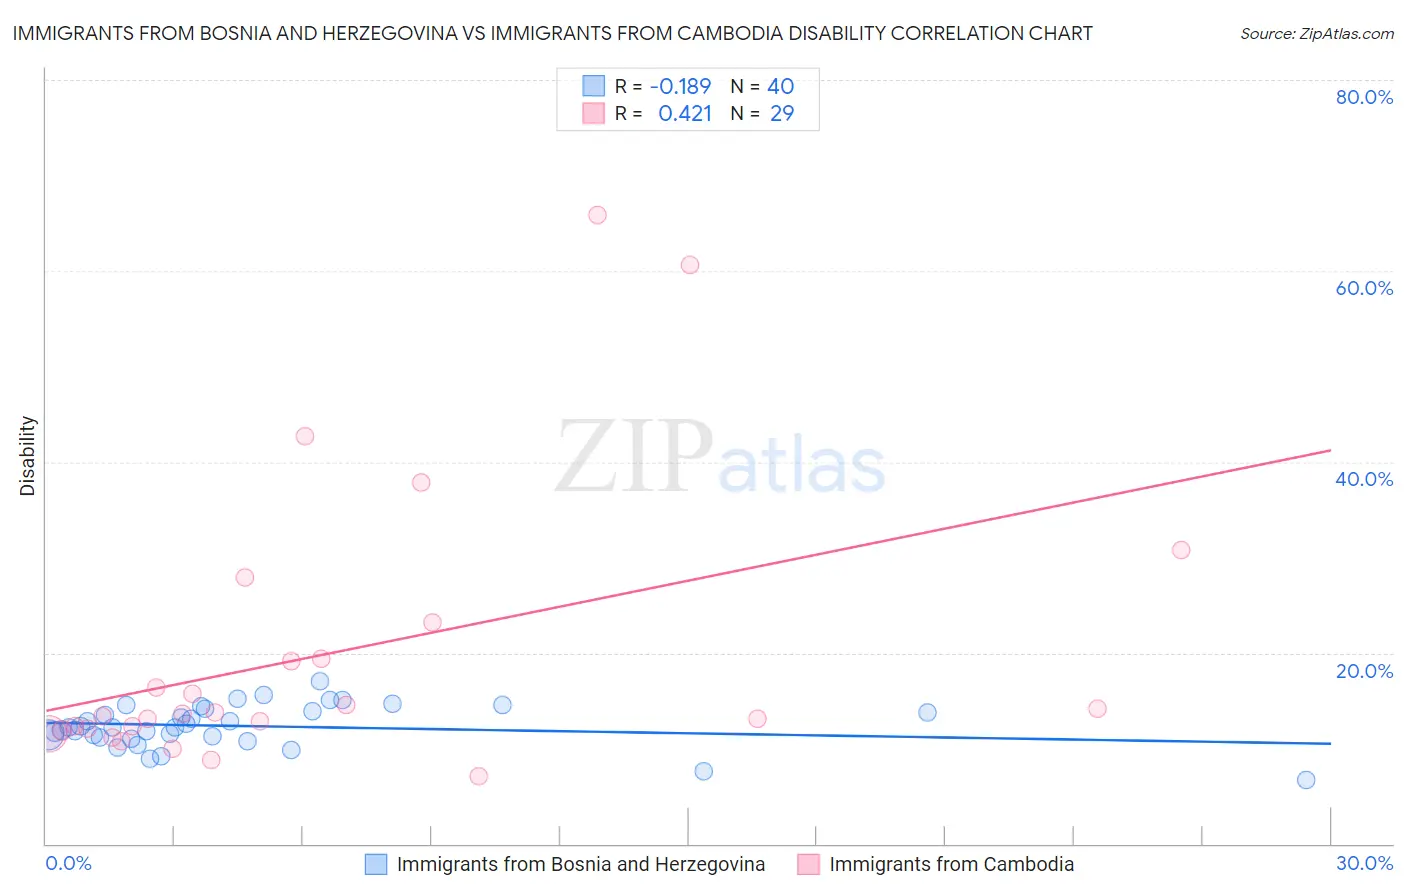
Immigrants from Bosnia and Herzegovina vs Immigrants from Cambodia Disability Correlation Chart
The statistical analysis conducted on geographies consisting of 156,819,615 people shows a poor negative correlation between the proportion of Immigrants from Bosnia and Herzegovina and percentage of population with a disability in the United States with a correlation coefficient (R) of -0.189 and weighted average of 11.9%. Similarly, the statistical analysis conducted on geographies consisting of 205,156,443 people shows a moderate positive correlation between the proportion of Immigrants from Cambodia and percentage of population with a disability in the United States with a correlation coefficient (R) of 0.421 and weighted average of 12.0%, a difference of 1.1%.
Disability Correlation Summary
| Measurement | Immigrants from Bosnia and Herzegovina | Immigrants from Cambodia |
| Minimum | 6.7% | 7.1% |
| Maximum | 17.0% | 65.9% |
| Range | 10.3% | 58.9% |
| Mean | 12.3% | 19.9% |
| Median | 12.2% | 13.6% |
| Interquartile 25% (IQ1) | 11.2% | 12.0% |
| Interquartile 75% (IQ3) | 14.0% | 21.2% |
| Interquartile Range (IQR) | 2.8% | 9.2% |
| Standard Deviation (Sample) | 2.2% | 14.7% |
| Standard Deviation (Population) | 2.2% | 14.4% |
Demographics Similar to Immigrants from Bosnia and Herzegovina and Immigrants from Cambodia by Disability
In terms of disability, the demographic groups most similar to Immigrants from Bosnia and Herzegovina are Lithuanian (11.9%, a difference of 0.050%), Somali (11.9%, a difference of 0.050%), Barbadian (11.9%, a difference of 0.17%), Serbian (11.9%, a difference of 0.21%), and Immigrants from Belize (11.9%, a difference of 0.22%). Similarly, the demographic groups most similar to Immigrants from Cambodia are Austrian (12.0%, a difference of 0.030%), Czech (12.0%, a difference of 0.080%), Danish (12.0%, a difference of 0.20%), Immigrants from Caribbean (12.0%, a difference of 0.25%), and Immigrants from Thailand (12.0%, a difference of 0.27%).
| Demographics | Rating | Rank | Disability |
| Lithuanians | 18.8 /100 | #192 | Poor 11.9% |
| Immigrants | Bosnia and Herzegovina | 18.0 /100 | #193 | Poor 11.9% |
| Somalis | 17.3 /100 | #194 | Poor 11.9% |
| Barbadians | 15.8 /100 | #195 | Poor 11.9% |
| Serbians | 15.4 /100 | #196 | Poor 11.9% |
| Immigrants | Belize | 15.2 /100 | #197 | Poor 11.9% |
| Ukrainians | 14.7 /100 | #198 | Poor 11.9% |
| Immigrants | Panama | 14.6 /100 | #199 | Poor 11.9% |
| Belizeans | 12.8 /100 | #200 | Poor 11.9% |
| Assyrians/Chaldeans/Syriacs | 12.6 /100 | #201 | Poor 11.9% |
| Immigrants | England | 12.0 /100 | #202 | Poor 12.0% |
| British West Indians | 11.5 /100 | #203 | Poor 12.0% |
| Mexican American Indians | 11.4 /100 | #204 | Poor 12.0% |
| Immigrants | Western Europe | 10.1 /100 | #205 | Poor 12.0% |
| Immigrants | Senegal | 9.4 /100 | #206 | Tragic 12.0% |
| Immigrants | Thailand | 9.3 /100 | #207 | Tragic 12.0% |
| Immigrants | Caribbean | 9.1 /100 | #208 | Tragic 12.0% |
| Danes | 8.7 /100 | #209 | Tragic 12.0% |
| Czechs | 7.9 /100 | #210 | Tragic 12.0% |
| Immigrants | Cambodia | 7.3 /100 | #211 | Tragic 12.0% |
| Austrians | 7.2 /100 | #212 | Tragic 12.0% |