Immigrants from Bosnia and Herzegovina vs Creek Disability
COMPARE
Immigrants from Bosnia and Herzegovina
Creek
Disability
Disability Comparison
Immigrants from Bosnia and Herzegovina
Creek
11.9%
DISABILITY
18.0/ 100
METRIC RATING
193rd/ 347
METRIC RANK
15.6%
DISABILITY
0.0/ 100
METRIC RATING
343rd/ 347
METRIC RANK
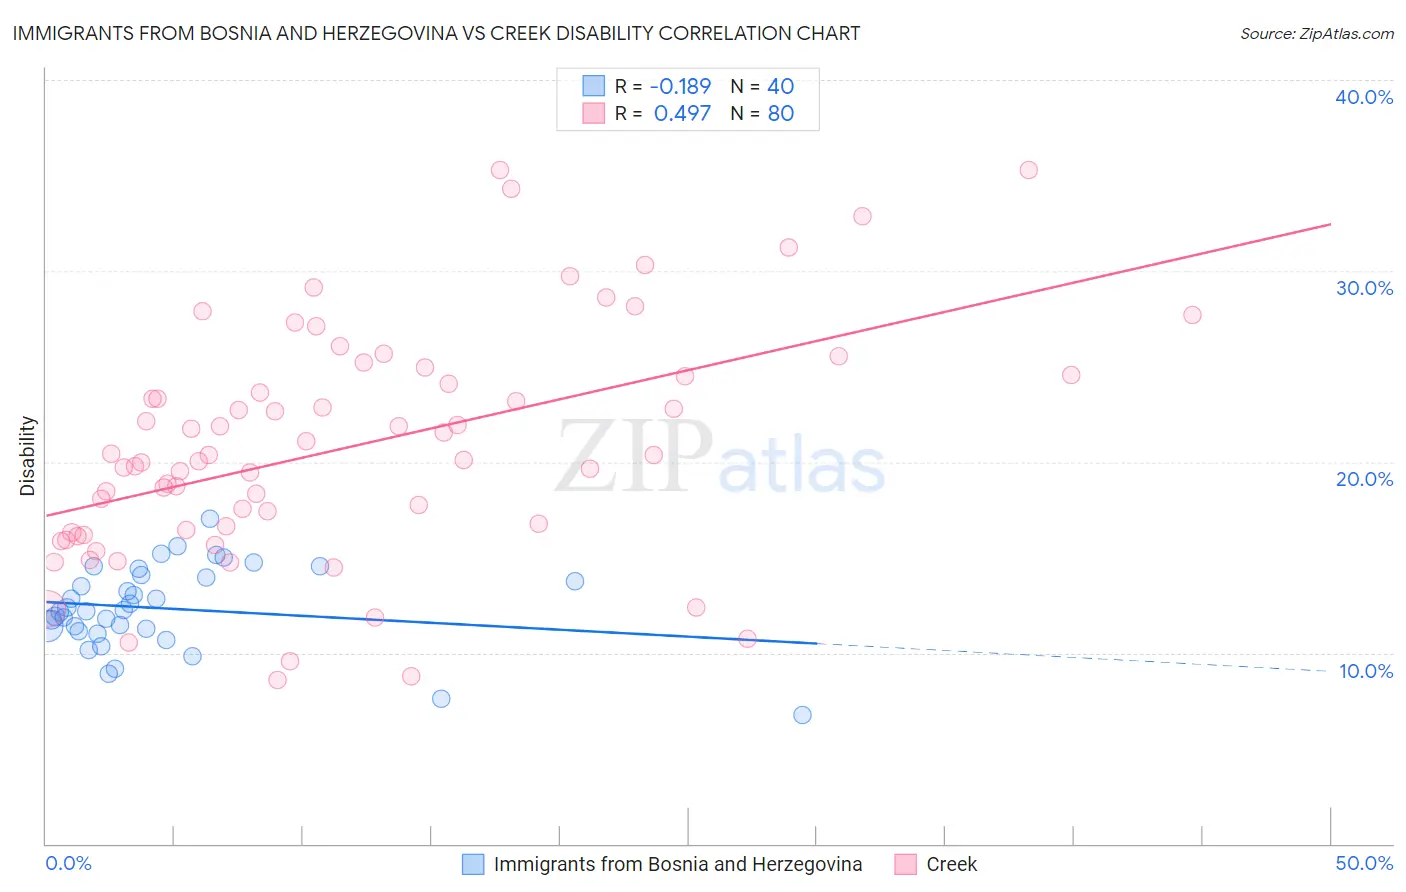
Immigrants from Bosnia and Herzegovina vs Creek Disability Correlation Chart
The statistical analysis conducted on geographies consisting of 156,819,615 people shows a poor negative correlation between the proportion of Immigrants from Bosnia and Herzegovina and percentage of population with a disability in the United States with a correlation coefficient (R) of -0.189 and weighted average of 11.9%. Similarly, the statistical analysis conducted on geographies consisting of 178,460,797 people shows a moderate positive correlation between the proportion of Creek and percentage of population with a disability in the United States with a correlation coefficient (R) of 0.497 and weighted average of 15.6%, a difference of 31.1%.
Disability Correlation Summary
| Measurement | Immigrants from Bosnia and Herzegovina | Creek |
| Minimum | 6.7% | 8.6% |
| Maximum | 17.0% | 35.3% |
| Range | 10.3% | 26.7% |
| Mean | 12.3% | 20.8% |
| Median | 12.2% | 20.2% |
| Interquartile 25% (IQ1) | 11.2% | 16.4% |
| Interquartile 75% (IQ3) | 14.0% | 24.5% |
| Interquartile Range (IQR) | 2.8% | 8.1% |
| Standard Deviation (Sample) | 2.2% | 6.1% |
| Standard Deviation (Population) | 2.2% | 6.0% |
Similar Demographics by Disability
Demographics Similar to Immigrants from Bosnia and Herzegovina by Disability
In terms of disability, the demographic groups most similar to Immigrants from Bosnia and Herzegovina are Lithuanian (11.9%, a difference of 0.050%), Somali (11.9%, a difference of 0.050%), Ute (11.9%, a difference of 0.10%), Barbadian (11.9%, a difference of 0.17%), and Immigrants from West Indies (11.9%, a difference of 0.21%).
| Demographics | Rating | Rank | Disability |
| Immigrants | Scotland | 28.2 /100 | #186 | Fair 11.8% |
| Lebanese | 27.9 /100 | #187 | Fair 11.8% |
| Immigrants | Mexico | 23.8 /100 | #188 | Fair 11.9% |
| Immigrants | Zaire | 21.8 /100 | #189 | Fair 11.9% |
| Immigrants | West Indies | 21.1 /100 | #190 | Fair 11.9% |
| Ute | 19.5 /100 | #191 | Poor 11.9% |
| Lithuanians | 18.8 /100 | #192 | Poor 11.9% |
| Immigrants | Bosnia and Herzegovina | 18.0 /100 | #193 | Poor 11.9% |
| Somalis | 17.3 /100 | #194 | Poor 11.9% |
| Barbadians | 15.8 /100 | #195 | Poor 11.9% |
| Serbians | 15.4 /100 | #196 | Poor 11.9% |
| Immigrants | Belize | 15.2 /100 | #197 | Poor 11.9% |
| Ukrainians | 14.7 /100 | #198 | Poor 11.9% |
| Immigrants | Panama | 14.6 /100 | #199 | Poor 11.9% |
| Belizeans | 12.8 /100 | #200 | Poor 11.9% |
Demographics Similar to Creek by Disability
In terms of disability, the demographic groups most similar to Creek are Kiowa (15.6%, a difference of 0.010%), Lumbee (15.5%, a difference of 0.47%), Colville (15.8%, a difference of 1.2%), Choctaw (15.4%, a difference of 1.3%), and Chickasaw (15.2%, a difference of 2.8%).
| Demographics | Rating | Rank | Disability |
| Cajuns | 0.0 /100 | #333 | Tragic 14.6% |
| Yuman | 0.0 /100 | #334 | Tragic 14.6% |
| Tohono O'odham | 0.0 /100 | #335 | Tragic 14.8% |
| Cherokee | 0.0 /100 | #336 | Tragic 14.8% |
| Seminole | 0.0 /100 | #337 | Tragic 14.9% |
| Dutch West Indians | 0.0 /100 | #338 | Tragic 14.9% |
| Chickasaw | 0.0 /100 | #339 | Tragic 15.2% |
| Choctaw | 0.0 /100 | #340 | Tragic 15.4% |
| Lumbee | 0.0 /100 | #341 | Tragic 15.5% |
| Kiowa | 0.0 /100 | #342 | Tragic 15.6% |
| Creek | 0.0 /100 | #343 | Tragic 15.6% |
| Colville | 0.0 /100 | #344 | Tragic 15.8% |
| Puerto Ricans | 0.0 /100 | #345 | Tragic 16.1% |
| Tsimshian | 0.0 /100 | #346 | Tragic 16.1% |
| Houma | 0.0 /100 | #347 | Tragic 17.1% |