Immigrants from Bolivia vs Lithuanian Disability
COMPARE
Immigrants from Bolivia
Lithuanian
Disability
Disability Comparison
Immigrants from Bolivia
Lithuanians
9.9%
DISABILITY
100.0/ 100
METRIC RATING
5th/ 347
METRIC RANK
11.9%
DISABILITY
18.8/ 100
METRIC RATING
192nd/ 347
METRIC RANK
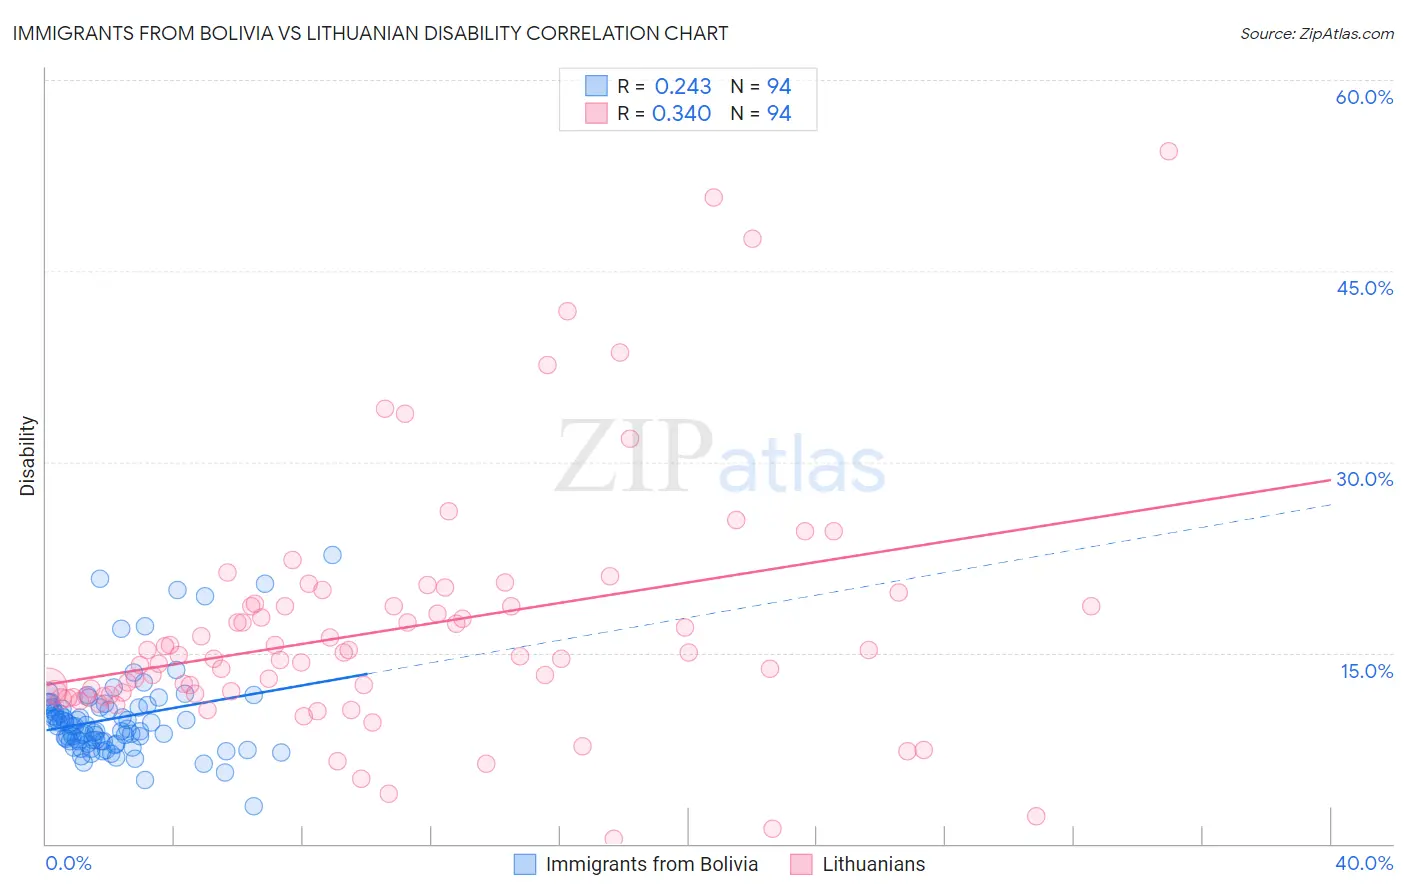
Immigrants from Bolivia vs Lithuanian Disability Correlation Chart
The statistical analysis conducted on geographies consisting of 158,717,616 people shows a weak positive correlation between the proportion of Immigrants from Bolivia and percentage of population with a disability in the United States with a correlation coefficient (R) of 0.243 and weighted average of 9.9%. Similarly, the statistical analysis conducted on geographies consisting of 421,948,731 people shows a mild positive correlation between the proportion of Lithuanians and percentage of population with a disability in the United States with a correlation coefficient (R) of 0.340 and weighted average of 11.9%, a difference of 20.5%.
Disability Correlation Summary
| Measurement | Immigrants from Bolivia | Lithuanian |
| Minimum | 3.0% | 0.40% |
| Maximum | 22.7% | 54.4% |
| Range | 19.7% | 54.0% |
| Mean | 9.9% | 16.8% |
| Median | 9.2% | 14.8% |
| Interquartile 25% (IQ1) | 8.1% | 11.7% |
| Interquartile 75% (IQ3) | 10.7% | 18.7% |
| Interquartile Range (IQR) | 2.6% | 7.0% |
| Standard Deviation (Sample) | 3.3% | 9.6% |
| Standard Deviation (Population) | 3.3% | 9.6% |
Similar Demographics by Disability
Demographics Similar to Immigrants from Bolivia by Disability
In terms of disability, the demographic groups most similar to Immigrants from Bolivia are Immigrants from South Central Asia (9.9%, a difference of 0.84%), Immigrants from Singapore (10.0%, a difference of 1.2%), Bolivian (10.0%, a difference of 1.4%), Thai (9.7%, a difference of 1.6%), and Immigrants from Hong Kong (10.0%, a difference of 1.7%).
| Demographics | Rating | Rank | Disability |
| Immigrants | India | 100.0 /100 | #1 | Exceptional 9.5% |
| Filipinos | 100.0 /100 | #2 | Exceptional 9.6% |
| Immigrants | Taiwan | 100.0 /100 | #3 | Exceptional 9.6% |
| Thais | 100.0 /100 | #4 | Exceptional 9.7% |
| Immigrants | Bolivia | 100.0 /100 | #5 | Exceptional 9.9% |
| Immigrants | South Central Asia | 100.0 /100 | #6 | Exceptional 9.9% |
| Immigrants | Singapore | 100.0 /100 | #7 | Exceptional 10.0% |
| Bolivians | 100.0 /100 | #8 | Exceptional 10.0% |
| Immigrants | Hong Kong | 100.0 /100 | #9 | Exceptional 10.0% |
| Immigrants | China | 100.0 /100 | #10 | Exceptional 10.1% |
| Iranians | 100.0 /100 | #11 | Exceptional 10.1% |
| Immigrants | Israel | 100.0 /100 | #12 | Exceptional 10.1% |
| Immigrants | Eastern Asia | 100.0 /100 | #13 | Exceptional 10.2% |
| Immigrants | Korea | 100.0 /100 | #14 | Exceptional 10.2% |
| Okinawans | 100.0 /100 | #15 | Exceptional 10.3% |
Demographics Similar to Lithuanians by Disability
In terms of disability, the demographic groups most similar to Lithuanians are Ute (11.9%, a difference of 0.050%), Immigrants from Bosnia and Herzegovina (11.9%, a difference of 0.050%), Somali (11.9%, a difference of 0.11%), Immigrants from West Indies (11.9%, a difference of 0.16%), and Immigrants from Zaire (11.9%, a difference of 0.21%).
| Demographics | Rating | Rank | Disability |
| Immigrants | Burma/Myanmar | 28.5 /100 | #185 | Fair 11.8% |
| Immigrants | Scotland | 28.2 /100 | #186 | Fair 11.8% |
| Lebanese | 27.9 /100 | #187 | Fair 11.8% |
| Immigrants | Mexico | 23.8 /100 | #188 | Fair 11.9% |
| Immigrants | Zaire | 21.8 /100 | #189 | Fair 11.9% |
| Immigrants | West Indies | 21.1 /100 | #190 | Fair 11.9% |
| Ute | 19.5 /100 | #191 | Poor 11.9% |
| Lithuanians | 18.8 /100 | #192 | Poor 11.9% |
| Immigrants | Bosnia and Herzegovina | 18.0 /100 | #193 | Poor 11.9% |
| Somalis | 17.3 /100 | #194 | Poor 11.9% |
| Barbadians | 15.8 /100 | #195 | Poor 11.9% |
| Serbians | 15.4 /100 | #196 | Poor 11.9% |
| Immigrants | Belize | 15.2 /100 | #197 | Poor 11.9% |
| Ukrainians | 14.7 /100 | #198 | Poor 11.9% |
| Immigrants | Panama | 14.6 /100 | #199 | Poor 11.9% |