Vietnamese vs Luxembourger Disability Age 5 to 17
COMPARE
Vietnamese
Luxembourger
Disability Age 5 to 17
Disability Age 5 to 17 Comparison
Vietnamese
Luxembourgers
5.1%
DISABILITY AGE 5 TO 17
100.0/ 100
METRIC RATING
47th/ 347
METRIC RANK
5.3%
DISABILITY AGE 5 TO 17
99.2/ 100
METRIC RATING
92nd/ 347
METRIC RANK
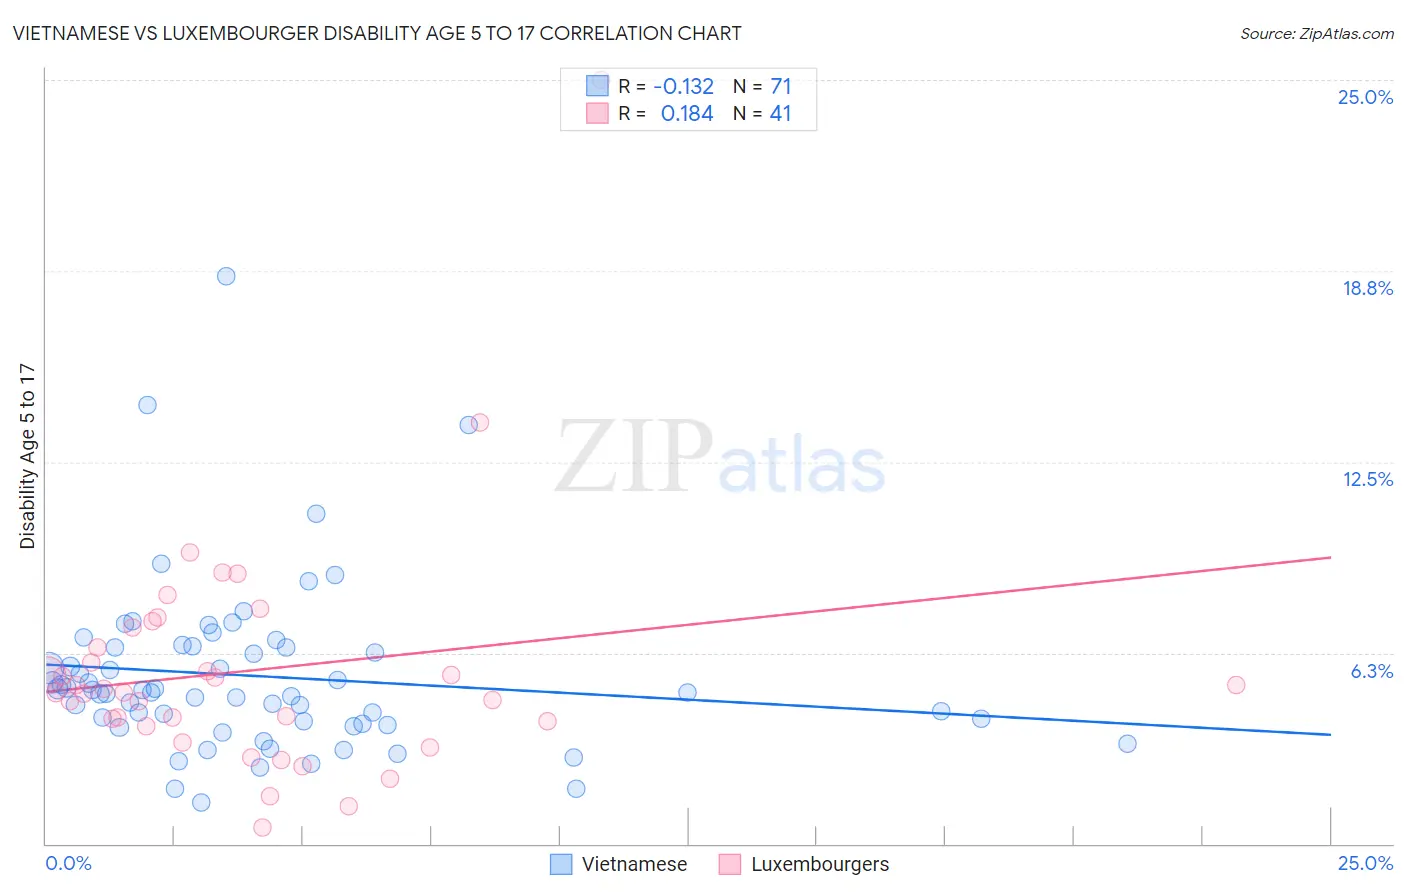
Vietnamese vs Luxembourger Disability Age 5 to 17 Correlation Chart
The statistical analysis conducted on geographies consisting of 170,164,131 people shows a poor negative correlation between the proportion of Vietnamese and percentage of population with a disability between the ages 5 and 17 in the United States with a correlation coefficient (R) of -0.132 and weighted average of 5.1%. Similarly, the statistical analysis conducted on geographies consisting of 143,736,782 people shows a poor positive correlation between the proportion of Luxembourgers and percentage of population with a disability between the ages 5 and 17 in the United States with a correlation coefficient (R) of 0.184 and weighted average of 5.3%, a difference of 4.3%.
Disability Age 5 to 17 Correlation Summary
| Measurement | Vietnamese | Luxembourger |
| Minimum | 1.4% | 0.53% |
| Maximum | 18.6% | 25.0% |
| Range | 17.2% | 24.5% |
| Mean | 5.5% | 5.7% |
| Median | 5.0% | 5.0% |
| Interquartile 25% (IQ1) | 3.9% | 3.9% |
| Interquartile 75% (IQ3) | 6.4% | 6.8% |
| Interquartile Range (IQR) | 2.5% | 2.8% |
| Standard Deviation (Sample) | 2.8% | 4.0% |
| Standard Deviation (Population) | 2.8% | 3.9% |
Similar Demographics by Disability Age 5 to 17
Demographics Similar to Vietnamese by Disability Age 5 to 17
In terms of disability age 5 to 17, the demographic groups most similar to Vietnamese are Assyrian/Chaldean/Syriac (5.0%, a difference of 0.13%), Korean (5.1%, a difference of 0.18%), Tongan (5.0%, a difference of 0.19%), Egyptian (5.0%, a difference of 0.27%), and Immigrants from Western Asia (5.1%, a difference of 0.27%).
| Demographics | Rating | Rank | Disability Age 5 to 17 |
| Okinawans | 100.0 /100 | #40 | Exceptional 5.0% |
| Immigrants | Australia | 100.0 /100 | #41 | Exceptional 5.0% |
| Immigrants | Sri Lanka | 100.0 /100 | #42 | Exceptional 5.0% |
| Immigrants | Russia | 100.0 /100 | #43 | Exceptional 5.0% |
| Egyptians | 100.0 /100 | #44 | Exceptional 5.0% |
| Tongans | 100.0 /100 | #45 | Exceptional 5.0% |
| Assyrians/Chaldeans/Syriacs | 100.0 /100 | #46 | Exceptional 5.0% |
| Vietnamese | 100.0 /100 | #47 | Exceptional 5.1% |
| Koreans | 100.0 /100 | #48 | Exceptional 5.1% |
| Immigrants | Western Asia | 100.0 /100 | #49 | Exceptional 5.1% |
| Argentineans | 99.9 /100 | #50 | Exceptional 5.1% |
| Turks | 99.9 /100 | #51 | Exceptional 5.1% |
| Immigrants | Fiji | 99.9 /100 | #52 | Exceptional 5.1% |
| Immigrants | Lithuania | 99.9 /100 | #53 | Exceptional 5.1% |
| Paraguayans | 99.9 /100 | #54 | Exceptional 5.1% |
Demographics Similar to Luxembourgers by Disability Age 5 to 17
In terms of disability age 5 to 17, the demographic groups most similar to Luxembourgers are Mongolian (5.3%, a difference of 0.010%), Immigrants from Peru (5.3%, a difference of 0.080%), Immigrants from Jordan (5.3%, a difference of 0.14%), Immigrants from Grenada (5.3%, a difference of 0.16%), and Immigrants from Kuwait (5.3%, a difference of 0.30%).
| Demographics | Rating | Rank | Disability Age 5 to 17 |
| Bulgarians | 99.4 /100 | #85 | Exceptional 5.2% |
| Immigrants | St. Vincent and the Grenadines | 99.4 /100 | #86 | Exceptional 5.2% |
| Eastern Europeans | 99.4 /100 | #87 | Exceptional 5.2% |
| Immigrants | Croatia | 99.4 /100 | #88 | Exceptional 5.2% |
| Immigrants | Spain | 99.4 /100 | #89 | Exceptional 5.2% |
| Immigrants | Kuwait | 99.4 /100 | #90 | Exceptional 5.3% |
| Mongolians | 99.2 /100 | #91 | Exceptional 5.3% |
| Luxembourgers | 99.2 /100 | #92 | Exceptional 5.3% |
| Immigrants | Peru | 99.1 /100 | #93 | Exceptional 5.3% |
| Immigrants | Jordan | 99.1 /100 | #94 | Exceptional 5.3% |
| Immigrants | Grenada | 99.1 /100 | #95 | Exceptional 5.3% |
| Immigrants | El Salvador | 99.0 /100 | #96 | Exceptional 5.3% |
| Immigrants | Europe | 99.0 /100 | #97 | Exceptional 5.3% |
| Immigrants | Austria | 98.9 /100 | #98 | Exceptional 5.3% |
| Cambodians | 98.8 /100 | #99 | Exceptional 5.3% |