Laotian vs Immigrants from Korea Self-Care Disability
COMPARE
Laotian
Immigrants from Korea
Self-Care Disability
Self-Care Disability Comparison
Laotians
Immigrants from Korea
2.4%
SELF-CARE DISABILITY
87.8/ 100
METRIC RATING
135th/ 347
METRIC RANK
2.3%
SELF-CARE DISABILITY
99.9/ 100
METRIC RATING
33rd/ 347
METRIC RANK
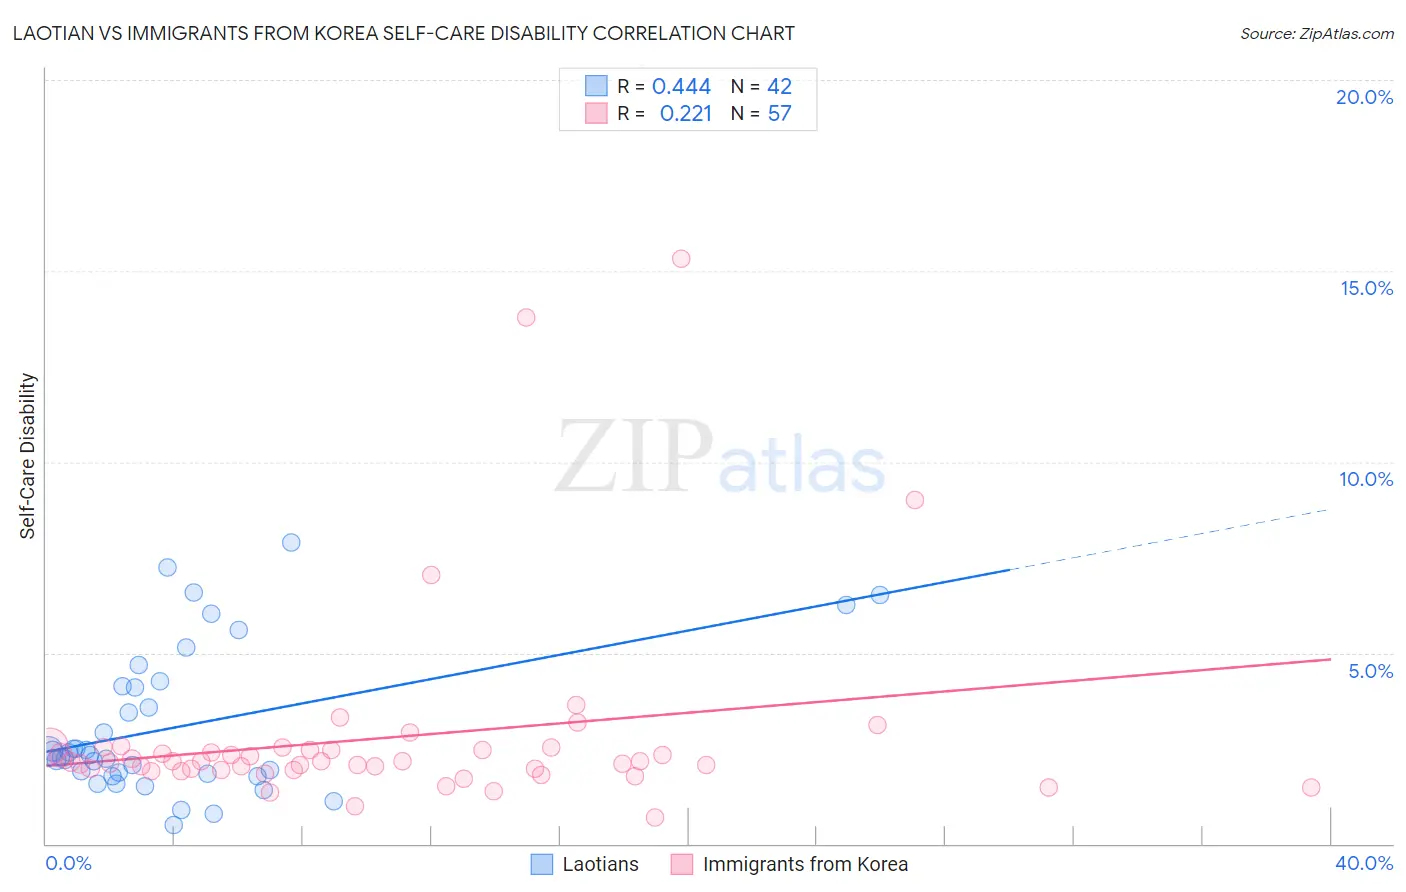
Laotian vs Immigrants from Korea Self-Care Disability Correlation Chart
The statistical analysis conducted on geographies consisting of 224,705,626 people shows a moderate positive correlation between the proportion of Laotians and percentage of population with self-care disability in the United States with a correlation coefficient (R) of 0.444 and weighted average of 2.4%. Similarly, the statistical analysis conducted on geographies consisting of 415,570,089 people shows a weak positive correlation between the proportion of Immigrants from Korea and percentage of population with self-care disability in the United States with a correlation coefficient (R) of 0.221 and weighted average of 2.3%, a difference of 6.4%.
Self-Care Disability Correlation Summary
| Measurement | Laotian | Immigrants from Korea |
| Minimum | 0.49% | 0.68% |
| Maximum | 7.9% | 15.3% |
| Range | 7.4% | 14.6% |
| Mean | 3.1% | 2.8% |
| Median | 2.4% | 2.1% |
| Interquartile 25% (IQ1) | 1.8% | 1.9% |
| Interquartile 75% (IQ3) | 4.1% | 2.5% |
| Interquartile Range (IQR) | 2.3% | 0.57% |
| Standard Deviation (Sample) | 1.9% | 2.6% |
| Standard Deviation (Population) | 1.9% | 2.6% |
Similar Demographics by Self-Care Disability
Demographics Similar to Laotians by Self-Care Disability
In terms of self-care disability, the demographic groups most similar to Laotians are Russian (2.4%, a difference of 0.050%), South American Indian (2.4%, a difference of 0.070%), Austrian (2.4%, a difference of 0.080%), Immigrants from Colombia (2.4%, a difference of 0.090%), and Immigrants from South America (2.4%, a difference of 0.12%).
| Demographics | Rating | Rank | Self-Care Disability |
| Immigrants | Hungary | 89.6 /100 | #128 | Excellent 2.4% |
| Immigrants | Romania | 89.3 /100 | #129 | Excellent 2.4% |
| Immigrants | Austria | 89.0 /100 | #130 | Excellent 2.4% |
| Poles | 88.9 /100 | #131 | Excellent 2.4% |
| Immigrants | South America | 88.8 /100 | #132 | Excellent 2.4% |
| Immigrants | Colombia | 88.5 /100 | #133 | Excellent 2.4% |
| Russians | 88.2 /100 | #134 | Excellent 2.4% |
| Laotians | 87.8 /100 | #135 | Excellent 2.4% |
| South American Indians | 87.2 /100 | #136 | Excellent 2.4% |
| Austrians | 87.0 /100 | #137 | Excellent 2.4% |
| Immigrants | Croatia | 86.6 /100 | #138 | Excellent 2.4% |
| Sri Lankans | 86.6 /100 | #139 | Excellent 2.4% |
| Immigrants | Uruguay | 85.4 /100 | #140 | Excellent 2.4% |
| Alaska Natives | 84.5 /100 | #141 | Excellent 2.4% |
| Immigrants | Peru | 83.2 /100 | #142 | Excellent 2.4% |
Demographics Similar to Immigrants from Korea by Self-Care Disability
In terms of self-care disability, the demographic groups most similar to Immigrants from Korea are Immigrants from Turkey (2.3%, a difference of 0.060%), Immigrants from Australia (2.3%, a difference of 0.12%), Immigrants from Lithuania (2.3%, a difference of 0.13%), Burmese (2.3%, a difference of 0.23%), and Danish (2.3%, a difference of 0.30%).
| Demographics | Rating | Rank | Self-Care Disability |
| Immigrants | Sri Lanka | 99.9 /100 | #26 | Exceptional 2.2% |
| Venezuelans | 99.9 /100 | #27 | Exceptional 2.2% |
| Inupiat | 99.9 /100 | #28 | Exceptional 2.2% |
| Immigrants | Zimbabwe | 99.9 /100 | #29 | Exceptional 2.3% |
| Paraguayans | 99.9 /100 | #30 | Exceptional 2.3% |
| Danes | 99.9 /100 | #31 | Exceptional 2.3% |
| Burmese | 99.9 /100 | #32 | Exceptional 2.3% |
| Immigrants | Korea | 99.9 /100 | #33 | Exceptional 2.3% |
| Immigrants | Turkey | 99.9 /100 | #34 | Exceptional 2.3% |
| Immigrants | Australia | 99.9 /100 | #35 | Exceptional 2.3% |
| Immigrants | Lithuania | 99.9 /100 | #36 | Exceptional 2.3% |
| Immigrants | Sweden | 99.9 /100 | #37 | Exceptional 2.3% |
| Immigrants | Eastern Africa | 99.9 /100 | #38 | Exceptional 2.3% |
| Immigrants | Bulgaria | 99.8 /100 | #39 | Exceptional 2.3% |
| Iranians | 99.8 /100 | #40 | Exceptional 2.3% |