Immigrants from Austria vs Pennsylvania German Disability
COMPARE
Immigrants from Austria
Pennsylvania German
Disability
Disability Comparison
Immigrants from Austria
Pennsylvania Germans
11.7%
DISABILITY
53.4/ 100
METRIC RATING
169th/ 347
METRIC RANK
13.2%
DISABILITY
0.0/ 100
METRIC RATING
300th/ 347
METRIC RANK
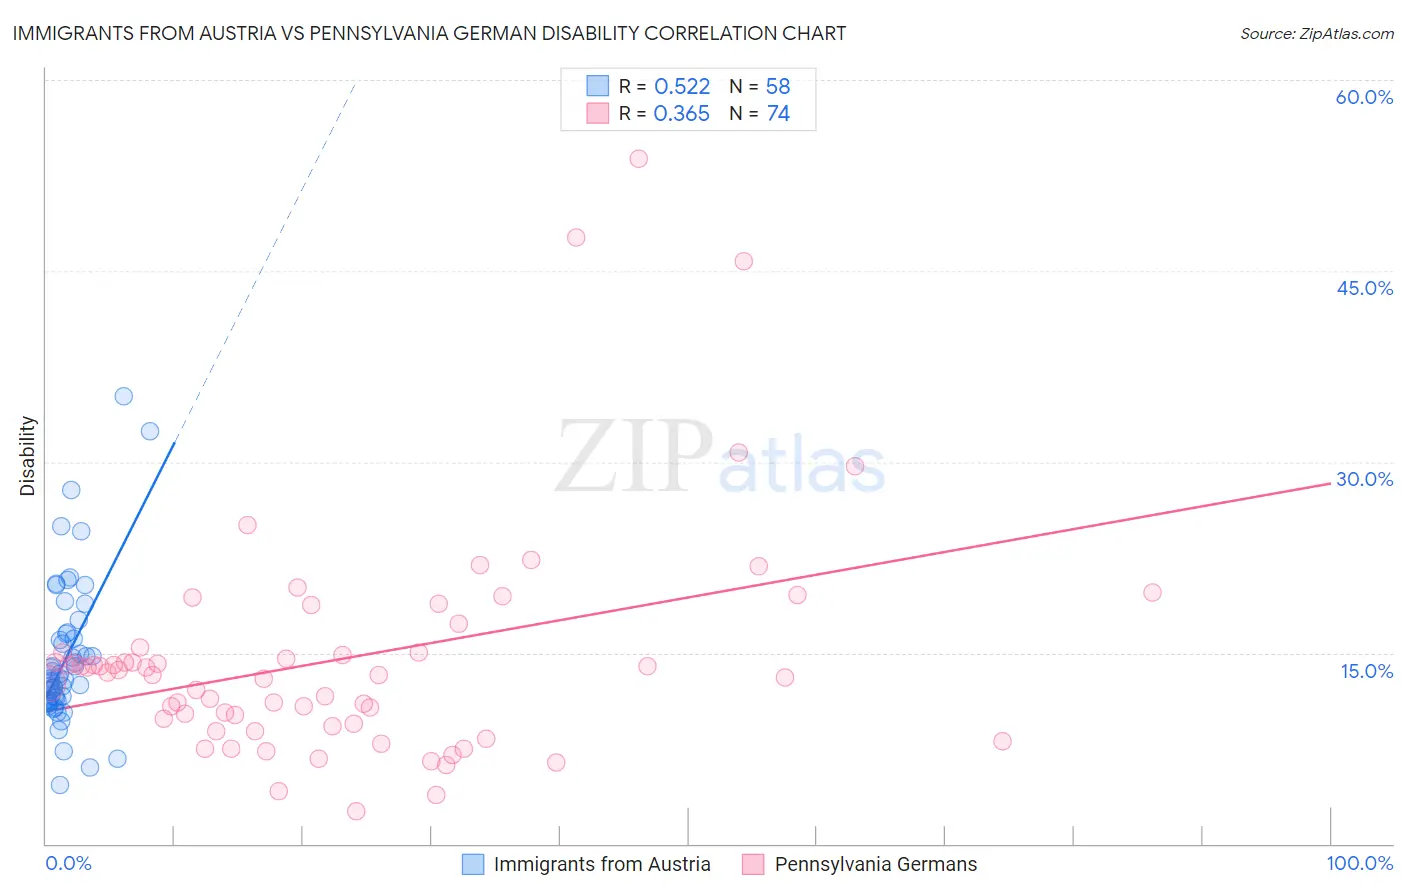
Immigrants from Austria vs Pennsylvania German Disability Correlation Chart
The statistical analysis conducted on geographies consisting of 167,973,413 people shows a substantial positive correlation between the proportion of Immigrants from Austria and percentage of population with a disability in the United States with a correlation coefficient (R) of 0.522 and weighted average of 11.7%. Similarly, the statistical analysis conducted on geographies consisting of 234,103,630 people shows a mild positive correlation between the proportion of Pennsylvania Germans and percentage of population with a disability in the United States with a correlation coefficient (R) of 0.365 and weighted average of 13.2%, a difference of 12.8%.
Disability Correlation Summary
| Measurement | Immigrants from Austria | Pennsylvania German |
| Minimum | 4.6% | 2.6% |
| Maximum | 35.2% | 53.8% |
| Range | 30.5% | 51.3% |
| Mean | 14.6% | 14.5% |
| Median | 13.0% | 13.4% |
| Interquartile 25% (IQ1) | 11.2% | 9.5% |
| Interquartile 75% (IQ3) | 16.5% | 15.1% |
| Interquartile Range (IQR) | 5.3% | 5.6% |
| Standard Deviation (Sample) | 5.8% | 9.0% |
| Standard Deviation (Population) | 5.8% | 8.9% |
Similar Demographics by Disability
Demographics Similar to Immigrants from Austria by Disability
In terms of disability, the demographic groups most similar to Immigrants from Austria are Immigrants from Latin America (11.7%, a difference of 0.030%), Immigrants from Albania (11.7%, a difference of 0.030%), Immigrants from Southern Europe (11.7%, a difference of 0.030%), Trinidadian and Tobagonian (11.7%, a difference of 0.030%), and Estonian (11.7%, a difference of 0.050%).
| Demographics | Rating | Rank | Disability |
| Immigrants | Haiti | 59.2 /100 | #162 | Average 11.7% |
| Immigrants | Trinidad and Tobago | 58.9 /100 | #163 | Average 11.7% |
| Syrians | 58.5 /100 | #164 | Average 11.7% |
| Cubans | 56.7 /100 | #165 | Average 11.7% |
| Pakistanis | 54.7 /100 | #166 | Average 11.7% |
| Estonians | 54.4 /100 | #167 | Average 11.7% |
| Immigrants | Latin America | 54.1 /100 | #168 | Average 11.7% |
| Immigrants | Austria | 53.4 /100 | #169 | Average 11.7% |
| Immigrants | Albania | 52.8 /100 | #170 | Average 11.7% |
| Immigrants | Southern Europe | 52.8 /100 | #171 | Average 11.7% |
| Trinidadians and Tobagonians | 52.7 /100 | #172 | Average 11.7% |
| Maltese | 50.6 /100 | #173 | Average 11.7% |
| Albanians | 50.0 /100 | #174 | Average 11.7% |
| Haitians | 48.6 /100 | #175 | Average 11.7% |
| Immigrants | Western Africa | 47.5 /100 | #176 | Average 11.7% |
Demographics Similar to Pennsylvania Germans by Disability
In terms of disability, the demographic groups most similar to Pennsylvania Germans are French (13.2%, a difference of 0.050%), Hopi (13.2%, a difference of 0.070%), Alaska Native (13.2%, a difference of 0.070%), Immigrants from Micronesia (13.2%, a difference of 0.090%), and Central American Indian (13.2%, a difference of 0.13%).
| Demographics | Rating | Rank | Disability |
| Marshallese | 0.0 /100 | #293 | Tragic 13.1% |
| Celtics | 0.0 /100 | #294 | Tragic 13.1% |
| Immigrants | Nonimmigrants | 0.0 /100 | #295 | Tragic 13.2% |
| Central American Indians | 0.0 /100 | #296 | Tragic 13.2% |
| Hopi | 0.0 /100 | #297 | Tragic 13.2% |
| Alaska Natives | 0.0 /100 | #298 | Tragic 13.2% |
| French | 0.0 /100 | #299 | Tragic 13.2% |
| Pennsylvania Germans | 0.0 /100 | #300 | Tragic 13.2% |
| Immigrants | Micronesia | 0.0 /100 | #301 | Tragic 13.2% |
| Arapaho | 0.0 /100 | #302 | Tragic 13.2% |
| Scotch-Irish | 0.0 /100 | #303 | Tragic 13.3% |
| Yakama | 0.0 /100 | #304 | Tragic 13.4% |
| French Canadians | 0.0 /100 | #305 | Tragic 13.4% |
| Cape Verdeans | 0.0 /100 | #306 | Tragic 13.5% |
| Shoshone | 0.0 /100 | #307 | Tragic 13.5% |