Estonian vs American Disability Age 5 to 17
COMPARE
Estonian
American
Disability Age 5 to 17
Disability Age 5 to 17 Comparison
Estonians
Americans
5.5%
DISABILITY AGE 5 TO 17
80.8/ 100
METRIC RATING
151st/ 347
METRIC RANK
6.5%
DISABILITY AGE 5 TO 17
0.0/ 100
METRIC RATING
325th/ 347
METRIC RANK
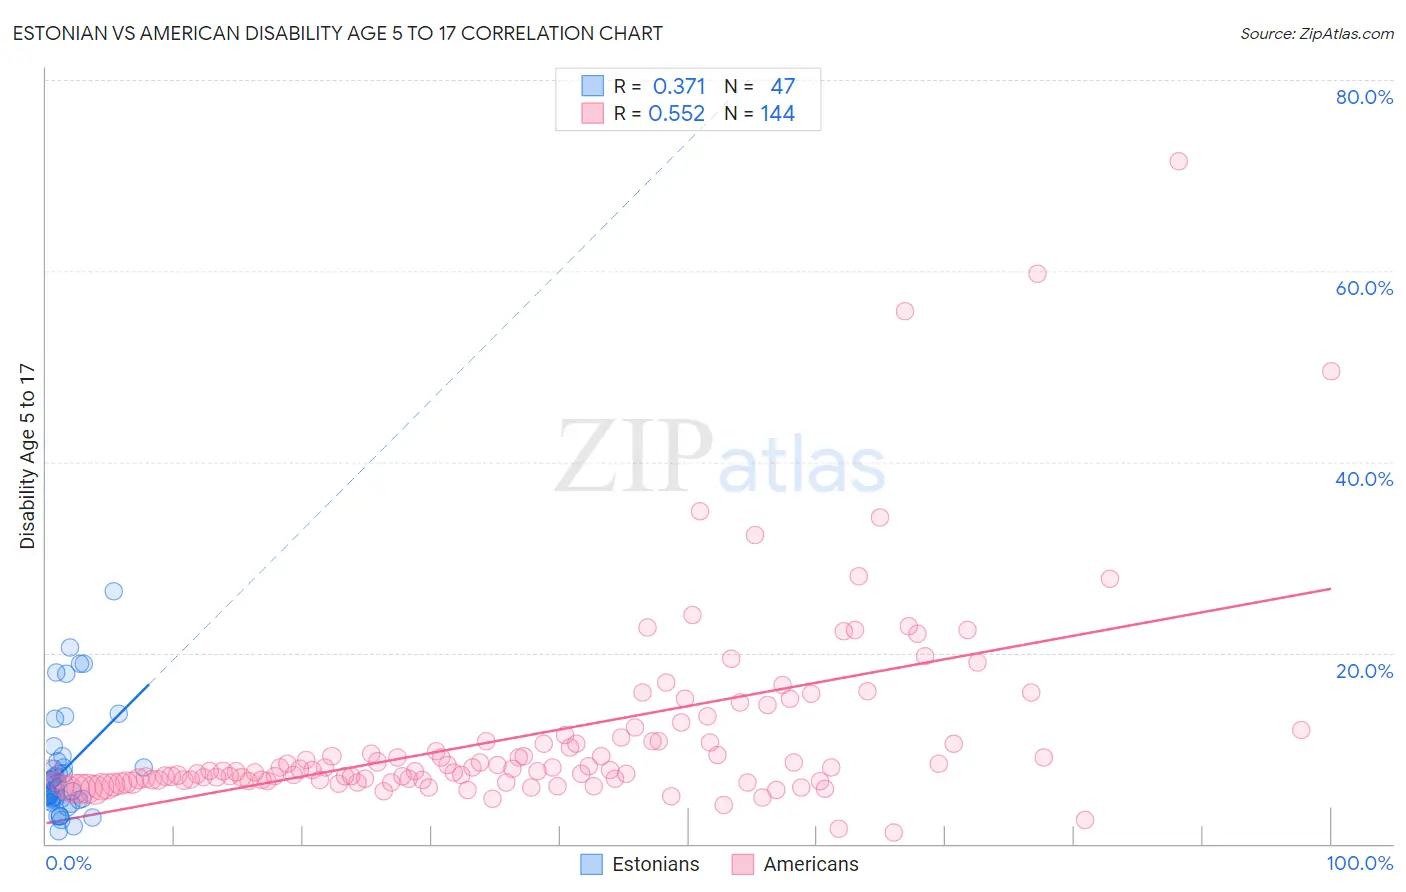
Estonian vs American Disability Age 5 to 17 Correlation Chart
The statistical analysis conducted on geographies consisting of 122,980,183 people shows a mild positive correlation between the proportion of Estonians and percentage of population with a disability between the ages 5 and 17 in the United States with a correlation coefficient (R) of 0.371 and weighted average of 5.5%. Similarly, the statistical analysis conducted on geographies consisting of 566,133,165 people shows a substantial positive correlation between the proportion of Americans and percentage of population with a disability between the ages 5 and 17 in the United States with a correlation coefficient (R) of 0.552 and weighted average of 6.5%, a difference of 18.7%.
Disability Age 5 to 17 Correlation Summary
| Measurement | Estonian | American |
| Minimum | 1.3% | 1.2% |
| Maximum | 26.5% | 71.4% |
| Range | 25.2% | 70.2% |
| Mean | 7.8% | 11.3% |
| Median | 5.5% | 7.7% |
| Interquartile 25% (IQ1) | 4.7% | 6.6% |
| Interquartile 75% (IQ3) | 8.6% | 10.8% |
| Interquartile Range (IQR) | 3.9% | 4.2% |
| Standard Deviation (Sample) | 5.6% | 10.2% |
| Standard Deviation (Population) | 5.5% | 10.2% |
Similar Demographics by Disability Age 5 to 17
Demographics Similar to Estonians by Disability Age 5 to 17
In terms of disability age 5 to 17, the demographic groups most similar to Estonians are Ute (5.5%, a difference of 0.010%), Guatemalan (5.5%, a difference of 0.060%), Central American (5.5%, a difference of 0.070%), Ecuadorian (5.5%, a difference of 0.080%), and Samoan (5.5%, a difference of 0.10%).
| Demographics | Rating | Rank | Disability Age 5 to 17 |
| Pakistanis | 87.3 /100 | #144 | Excellent 5.5% |
| Immigrants | Guatemala | 86.6 /100 | #145 | Excellent 5.5% |
| Albanians | 83.7 /100 | #146 | Excellent 5.5% |
| Immigrants | Albania | 83.1 /100 | #147 | Excellent 5.5% |
| Samoans | 81.9 /100 | #148 | Excellent 5.5% |
| Central Americans | 81.6 /100 | #149 | Excellent 5.5% |
| Guatemalans | 81.5 /100 | #150 | Excellent 5.5% |
| Estonians | 80.8 /100 | #151 | Excellent 5.5% |
| Ute | 80.6 /100 | #152 | Excellent 5.5% |
| Ecuadorians | 79.7 /100 | #153 | Good 5.5% |
| Australians | 78.8 /100 | #154 | Good 5.5% |
| Immigrants | Ecuador | 78.3 /100 | #155 | Good 5.5% |
| Hawaiians | 78.0 /100 | #156 | Good 5.5% |
| Immigrants | Costa Rica | 77.9 /100 | #157 | Good 5.5% |
| Immigrants | Nepal | 77.1 /100 | #158 | Good 5.5% |
Demographics Similar to Americans by Disability Age 5 to 17
In terms of disability age 5 to 17, the demographic groups most similar to Americans are Dominican (6.5%, a difference of 0.050%), Potawatomi (6.5%, a difference of 0.13%), Osage (6.5%, a difference of 0.14%), Slovak (6.5%, a difference of 0.17%), and Tohono O'odham (6.5%, a difference of 0.19%).
| Demographics | Rating | Rank | Disability Age 5 to 17 |
| Comanche | 0.0 /100 | #318 | Tragic 6.4% |
| Delaware | 0.0 /100 | #319 | Tragic 6.5% |
| Africans | 0.0 /100 | #320 | Tragic 6.5% |
| Tohono O'odham | 0.0 /100 | #321 | Tragic 6.5% |
| Slovaks | 0.0 /100 | #322 | Tragic 6.5% |
| Osage | 0.0 /100 | #323 | Tragic 6.5% |
| Dominicans | 0.0 /100 | #324 | Tragic 6.5% |
| Americans | 0.0 /100 | #325 | Tragic 6.5% |
| Potawatomi | 0.0 /100 | #326 | Tragic 6.5% |
| French American Indians | 0.0 /100 | #327 | Tragic 6.6% |
| Pennsylvania Germans | 0.0 /100 | #328 | Tragic 6.6% |
| Blackfeet | 0.0 /100 | #329 | Tragic 6.6% |
| Dutch West Indians | 0.0 /100 | #330 | Tragic 6.7% |
| French Canadians | 0.0 /100 | #331 | Tragic 6.7% |
| Immigrants | Azores | 0.0 /100 | #332 | Tragic 6.7% |