Immigrants from Afghanistan vs American Disability Age 5 to 17
COMPARE
Immigrants from Afghanistan
American
Disability Age 5 to 17
Disability Age 5 to 17 Comparison
Immigrants from Afghanistan
Americans
5.3%
DISABILITY AGE 5 TO 17
97.4/ 100
METRIC RATING
117th/ 347
METRIC RANK
6.5%
DISABILITY AGE 5 TO 17
0.0/ 100
METRIC RATING
325th/ 347
METRIC RANK
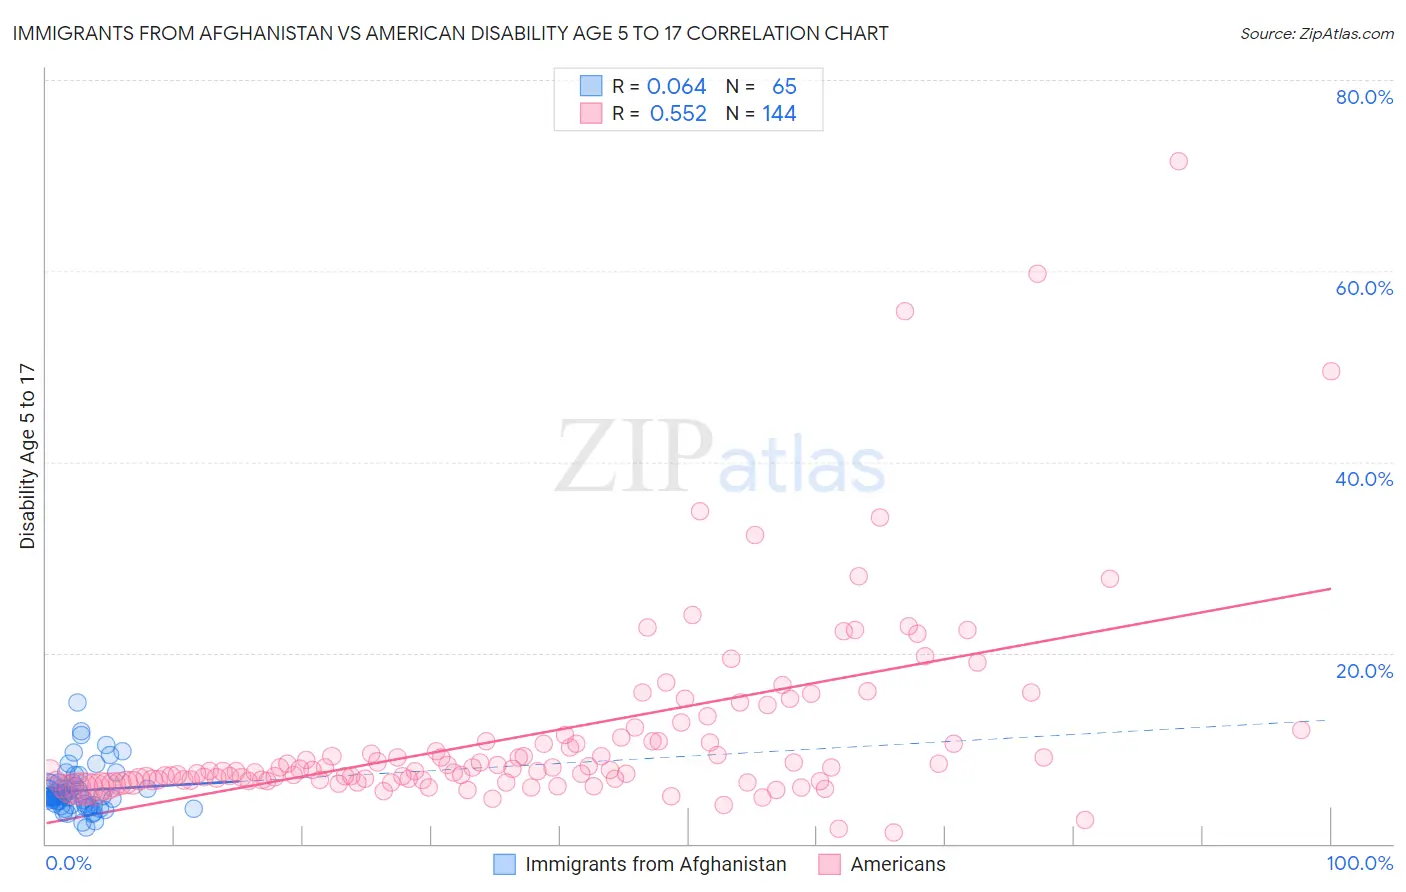
Immigrants from Afghanistan vs American Disability Age 5 to 17 Correlation Chart
The statistical analysis conducted on geographies consisting of 147,197,309 people shows a slight positive correlation between the proportion of Immigrants from Afghanistan and percentage of population with a disability between the ages 5 and 17 in the United States with a correlation coefficient (R) of 0.064 and weighted average of 5.3%. Similarly, the statistical analysis conducted on geographies consisting of 566,133,165 people shows a substantial positive correlation between the proportion of Americans and percentage of population with a disability between the ages 5 and 17 in the United States with a correlation coefficient (R) of 0.552 and weighted average of 6.5%, a difference of 22.0%.
Disability Age 5 to 17 Correlation Summary
| Measurement | Immigrants from Afghanistan | American |
| Minimum | 1.7% | 1.2% |
| Maximum | 14.8% | 71.4% |
| Range | 13.1% | 70.2% |
| Mean | 5.6% | 11.3% |
| Median | 5.0% | 7.7% |
| Interquartile 25% (IQ1) | 4.0% | 6.6% |
| Interquartile 75% (IQ3) | 6.1% | 10.8% |
| Interquartile Range (IQR) | 2.1% | 4.2% |
| Standard Deviation (Sample) | 2.4% | 10.2% |
| Standard Deviation (Population) | 2.4% | 10.2% |
Similar Demographics by Disability Age 5 to 17
Demographics Similar to Immigrants from Afghanistan by Disability Age 5 to 17
In terms of disability age 5 to 17, the demographic groups most similar to Immigrants from Afghanistan are South American (5.4%, a difference of 0.11%), Immigrants from South America (5.4%, a difference of 0.11%), Cypriot (5.3%, a difference of 0.16%), Immigrants (5.4%, a difference of 0.17%), and Cuban (5.3%, a difference of 0.23%).
| Demographics | Rating | Rank | Disability Age 5 to 17 |
| Immigrants | Eritrea | 98.0 /100 | #110 | Exceptional 5.3% |
| Ethiopians | 97.9 /100 | #111 | Exceptional 5.3% |
| Immigrants | Latvia | 97.9 /100 | #112 | Exceptional 5.3% |
| Aleuts | 97.8 /100 | #113 | Exceptional 5.3% |
| Immigrants | Northern Europe | 97.8 /100 | #114 | Exceptional 5.3% |
| Cubans | 97.8 /100 | #115 | Exceptional 5.3% |
| Cypriots | 97.7 /100 | #116 | Exceptional 5.3% |
| Immigrants | Afghanistan | 97.4 /100 | #117 | Exceptional 5.3% |
| South Americans | 97.1 /100 | #118 | Exceptional 5.4% |
| Immigrants | South America | 97.1 /100 | #119 | Exceptional 5.4% |
| Immigrants | Immigrants | 97.0 /100 | #120 | Exceptional 5.4% |
| Maltese | 96.0 /100 | #121 | Exceptional 5.4% |
| Chileans | 95.8 /100 | #122 | Exceptional 5.4% |
| Immigrants | Ethiopia | 95.5 /100 | #123 | Exceptional 5.4% |
| Crow | 95.0 /100 | #124 | Exceptional 5.4% |
Demographics Similar to Americans by Disability Age 5 to 17
In terms of disability age 5 to 17, the demographic groups most similar to Americans are Dominican (6.5%, a difference of 0.050%), Potawatomi (6.5%, a difference of 0.13%), Osage (6.5%, a difference of 0.14%), Slovak (6.5%, a difference of 0.17%), and Tohono O'odham (6.5%, a difference of 0.19%).
| Demographics | Rating | Rank | Disability Age 5 to 17 |
| Comanche | 0.0 /100 | #318 | Tragic 6.4% |
| Delaware | 0.0 /100 | #319 | Tragic 6.5% |
| Africans | 0.0 /100 | #320 | Tragic 6.5% |
| Tohono O'odham | 0.0 /100 | #321 | Tragic 6.5% |
| Slovaks | 0.0 /100 | #322 | Tragic 6.5% |
| Osage | 0.0 /100 | #323 | Tragic 6.5% |
| Dominicans | 0.0 /100 | #324 | Tragic 6.5% |
| Americans | 0.0 /100 | #325 | Tragic 6.5% |
| Potawatomi | 0.0 /100 | #326 | Tragic 6.5% |
| French American Indians | 0.0 /100 | #327 | Tragic 6.6% |
| Pennsylvania Germans | 0.0 /100 | #328 | Tragic 6.6% |
| Blackfeet | 0.0 /100 | #329 | Tragic 6.6% |
| Dutch West Indians | 0.0 /100 | #330 | Tragic 6.7% |
| French Canadians | 0.0 /100 | #331 | Tragic 6.7% |
| Immigrants | Azores | 0.0 /100 | #332 | Tragic 6.7% |