Immigrants from Austria vs American Male Unemployment
COMPARE
Immigrants from Austria
American
Male Unemployment
Male Unemployment Comparison
Immigrants from Austria
Americans
5.1%
MALE UNEMPLOYMENT
90.3/ 100
METRIC RATING
113th/ 347
METRIC RANK
5.2%
MALE UNEMPLOYMENT
72.7/ 100
METRIC RATING
156th/ 347
METRIC RANK
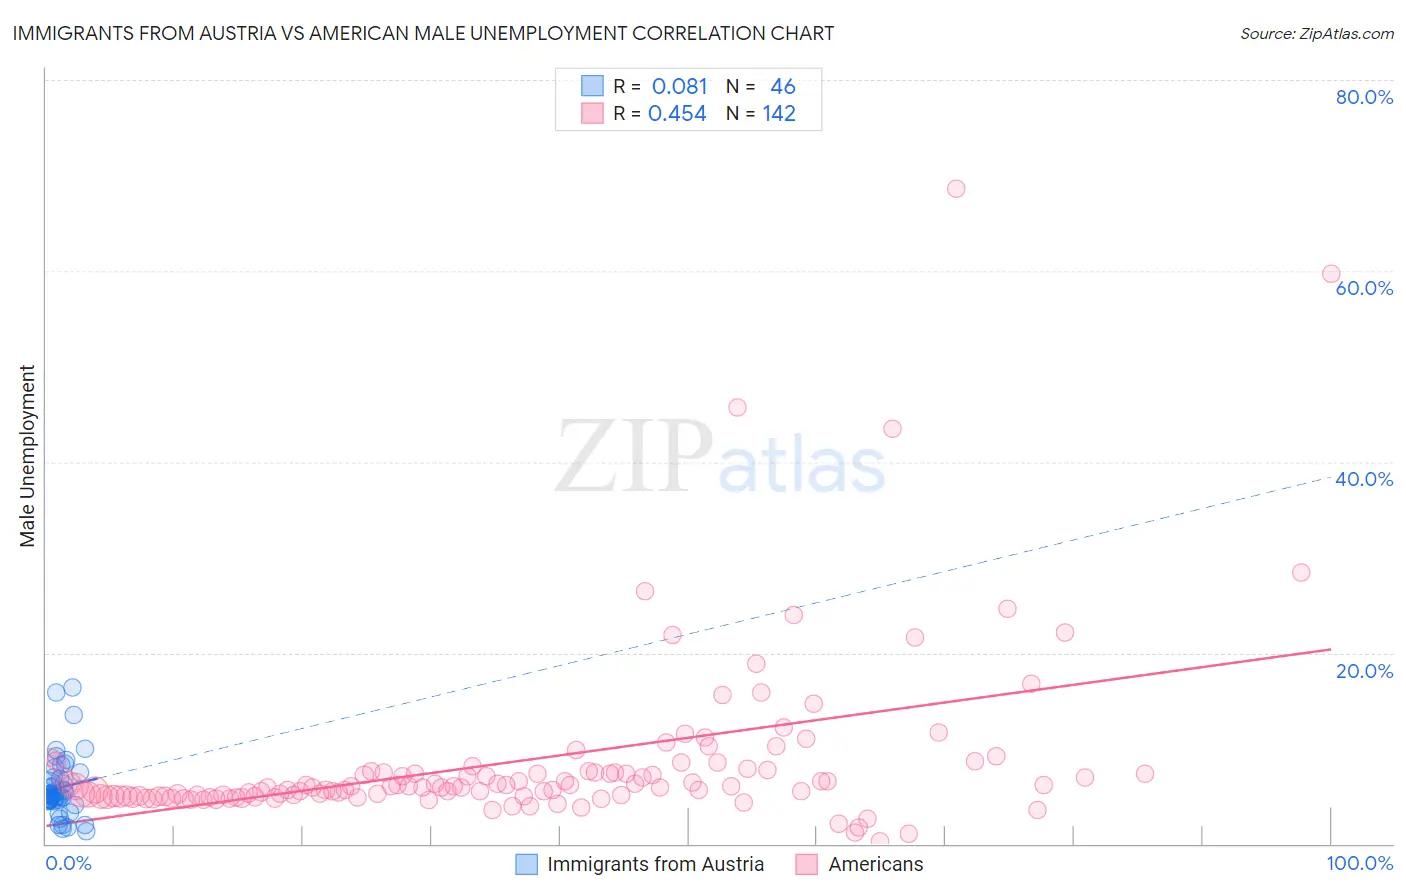
Immigrants from Austria vs American Male Unemployment Correlation Chart
The statistical analysis conducted on geographies consisting of 167,645,356 people shows a slight positive correlation between the proportion of Immigrants from Austria and unemployment rate among males in the United States with a correlation coefficient (R) of 0.081 and weighted average of 5.1%. Similarly, the statistical analysis conducted on geographies consisting of 568,902,342 people shows a moderate positive correlation between the proportion of Americans and unemployment rate among males in the United States with a correlation coefficient (R) of 0.454 and weighted average of 5.2%, a difference of 1.9%.
Male Unemployment Correlation Summary
| Measurement | Immigrants from Austria | American |
| Minimum | 1.3% | 0.30% |
| Maximum | 16.4% | 68.6% |
| Range | 15.1% | 68.3% |
| Mean | 5.9% | 8.7% |
| Median | 5.2% | 6.0% |
| Interquartile 25% (IQ1) | 4.5% | 5.0% |
| Interquartile 75% (IQ3) | 7.0% | 7.6% |
| Interquartile Range (IQR) | 2.5% | 2.6% |
| Standard Deviation (Sample) | 3.3% | 9.3% |
| Standard Deviation (Population) | 3.3% | 9.3% |
Similar Demographics by Male Unemployment
Demographics Similar to Immigrants from Austria by Male Unemployment
In terms of male unemployment, the demographic groups most similar to Immigrants from Austria are Immigrants from Moldova (5.1%, a difference of 0.010%), Romanian (5.1%, a difference of 0.080%), Immigrants from Eastern Asia (5.1%, a difference of 0.090%), Immigrants from England (5.1%, a difference of 0.10%), and Immigrants from Asia (5.1%, a difference of 0.11%).
| Demographics | Rating | Rank | Male Unemployment |
| Immigrants | Ethiopia | 91.5 /100 | #106 | Exceptional 5.1% |
| Ethiopians | 91.3 /100 | #107 | Exceptional 5.1% |
| Immigrants | Nicaragua | 91.2 /100 | #108 | Exceptional 5.1% |
| Immigrants | Pakistan | 90.9 /100 | #109 | Exceptional 5.1% |
| Immigrants | England | 90.8 /100 | #110 | Exceptional 5.1% |
| Immigrants | Eastern Asia | 90.8 /100 | #111 | Exceptional 5.1% |
| Immigrants | Moldova | 90.3 /100 | #112 | Exceptional 5.1% |
| Immigrants | Austria | 90.3 /100 | #113 | Exceptional 5.1% |
| Romanians | 89.8 /100 | #114 | Excellent 5.1% |
| Immigrants | Asia | 89.6 /100 | #115 | Excellent 5.1% |
| Immigrants | Denmark | 89.4 /100 | #116 | Excellent 5.1% |
| Estonians | 89.0 /100 | #117 | Excellent 5.1% |
| Cypriots | 88.8 /100 | #118 | Excellent 5.1% |
| French Canadians | 88.6 /100 | #119 | Excellent 5.1% |
| Ukrainians | 88.4 /100 | #120 | Excellent 5.1% |
Demographics Similar to Americans by Male Unemployment
In terms of male unemployment, the demographic groups most similar to Americans are Immigrants from Northern Africa (5.2%, a difference of 0.030%), Immigrants from Hungary (5.2%, a difference of 0.060%), Immigrants from Indonesia (5.2%, a difference of 0.080%), Immigrants from Uruguay (5.2%, a difference of 0.090%), and Laotian (5.2%, a difference of 0.090%).
| Demographics | Rating | Rank | Male Unemployment |
| Immigrants | Europe | 76.2 /100 | #149 | Good 5.2% |
| Indians (Asian) | 76.0 /100 | #150 | Good 5.2% |
| Slovaks | 75.5 /100 | #151 | Good 5.2% |
| Egyptians | 74.8 /100 | #152 | Good 5.2% |
| Immigrants | Uruguay | 73.9 /100 | #153 | Good 5.2% |
| Laotians | 73.8 /100 | #154 | Good 5.2% |
| Immigrants | Hungary | 73.4 /100 | #155 | Good 5.2% |
| Americans | 72.7 /100 | #156 | Good 5.2% |
| Immigrants | Northern Africa | 72.3 /100 | #157 | Good 5.2% |
| Immigrants | Indonesia | 71.5 /100 | #158 | Good 5.2% |
| Indonesians | 71.2 /100 | #159 | Good 5.2% |
| Immigrants | Norway | 71.0 /100 | #160 | Good 5.2% |
| Immigrants | China | 70.6 /100 | #161 | Good 5.2% |
| Immigrants | Egypt | 65.9 /100 | #162 | Good 5.2% |
| Immigrants | Hong Kong | 65.7 /100 | #163 | Good 5.2% |