Immigrants from Argentina vs Cherokee Disability Age Under 5
COMPARE
Immigrants from Argentina
Cherokee
Disability Age Under 5
Disability Age Under 5 Comparison
Immigrants from Argentina
Cherokee
1.2%
DISABILITY AGE UNDER 5
60.2/ 100
METRIC RATING
167th/ 347
METRIC RANK
1.8%
DISABILITY AGE UNDER 5
0.0/ 100
METRIC RATING
324th/ 347
METRIC RANK
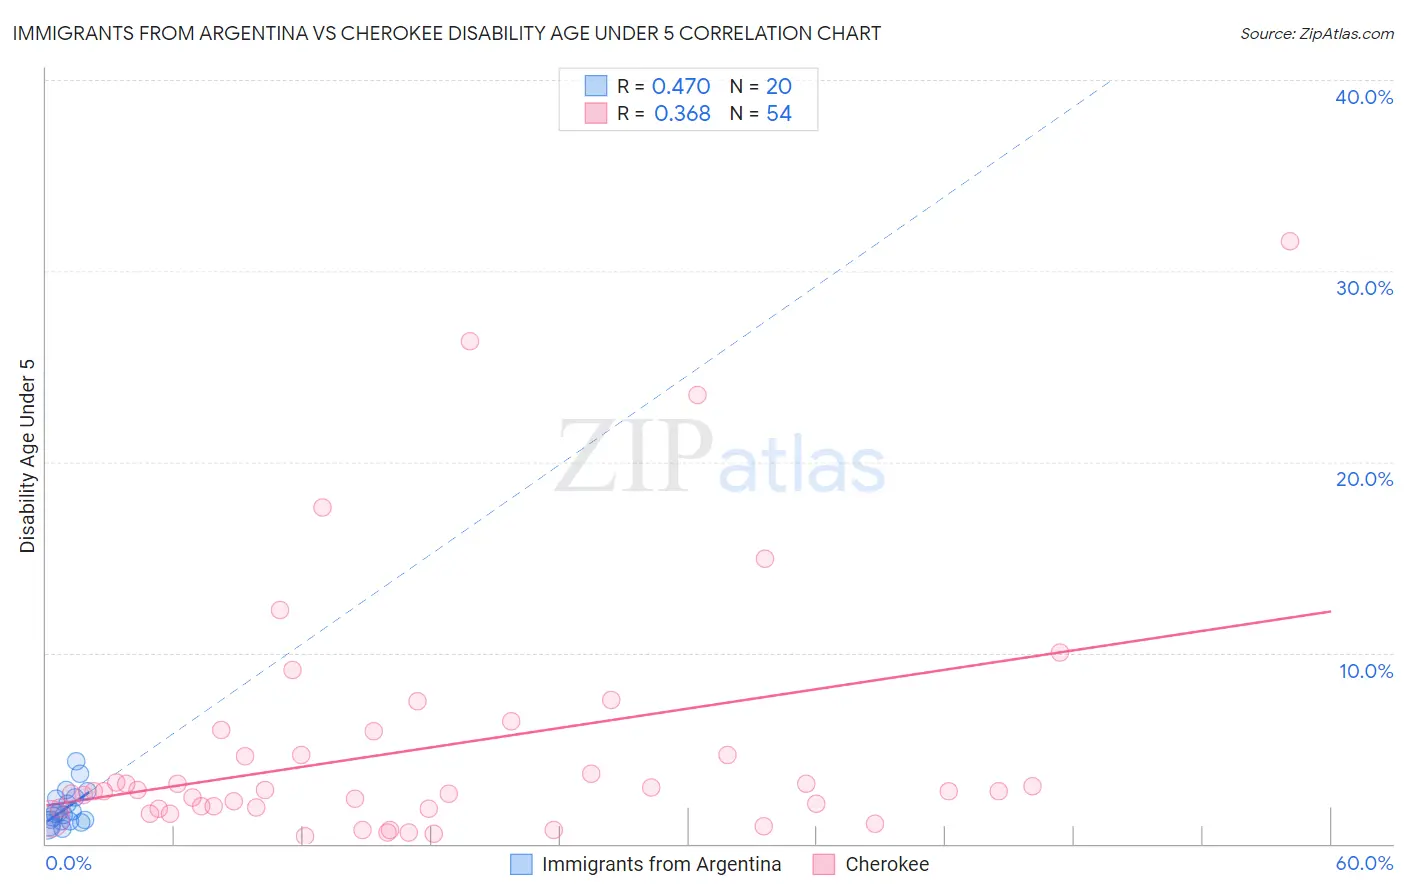
Immigrants from Argentina vs Cherokee Disability Age Under 5 Correlation Chart
The statistical analysis conducted on geographies consisting of 162,990,618 people shows a moderate positive correlation between the proportion of Immigrants from Argentina and percentage of population with a disability under the age of 5 in the United States with a correlation coefficient (R) of 0.470 and weighted average of 1.2%. Similarly, the statistical analysis conducted on geographies consisting of 245,498,601 people shows a mild positive correlation between the proportion of Cherokee and percentage of population with a disability under the age of 5 in the United States with a correlation coefficient (R) of 0.368 and weighted average of 1.8%, a difference of 44.2%.
Disability Age Under 5 Correlation Summary
| Measurement | Immigrants from Argentina | Cherokee |
| Minimum | 0.80% | 0.42% |
| Maximum | 4.3% | 31.6% |
| Range | 3.5% | 31.2% |
| Mean | 1.9% | 5.0% |
| Median | 1.6% | 2.8% |
| Interquartile 25% (IQ1) | 1.2% | 1.9% |
| Interquartile 75% (IQ3) | 2.4% | 4.7% |
| Interquartile Range (IQR) | 1.2% | 2.8% |
| Standard Deviation (Sample) | 0.95% | 6.5% |
| Standard Deviation (Population) | 0.93% | 6.4% |
Similar Demographics by Disability Age Under 5
Demographics Similar to Immigrants from Argentina by Disability Age Under 5
In terms of disability age under 5, the demographic groups most similar to Immigrants from Argentina are Immigrants from Central America (1.2%, a difference of 0.11%), Sierra Leonean (1.2%, a difference of 0.11%), Immigrants from Uruguay (1.2%, a difference of 0.12%), Immigrants from Jamaica (1.2%, a difference of 0.13%), and Immigrants from Kuwait (1.2%, a difference of 0.22%).
| Demographics | Rating | Rank | Disability Age Under 5 |
| Immigrants | Latin America | 65.8 /100 | #160 | Good 1.2% |
| Immigrants | Africa | 65.1 /100 | #161 | Good 1.2% |
| Guatemalans | 63.6 /100 | #162 | Good 1.2% |
| Immigrants | Guatemala | 63.2 /100 | #163 | Good 1.2% |
| Laotians | 62.8 /100 | #164 | Good 1.2% |
| Immigrants | Kuwait | 62.6 /100 | #165 | Good 1.2% |
| Immigrants | Central America | 61.4 /100 | #166 | Good 1.2% |
| Immigrants | Argentina | 60.2 /100 | #167 | Good 1.2% |
| Sierra Leoneans | 59.1 /100 | #168 | Average 1.2% |
| Immigrants | Uruguay | 59.0 /100 | #169 | Average 1.2% |
| Immigrants | Jamaica | 58.8 /100 | #170 | Average 1.2% |
| Guamanians/Chamorros | 57.8 /100 | #171 | Average 1.2% |
| Crow | 51.0 /100 | #172 | Average 1.2% |
| Immigrants | Ireland | 50.3 /100 | #173 | Average 1.2% |
| Immigrants | Latvia | 50.0 /100 | #174 | Average 1.2% |
Demographics Similar to Cherokee by Disability Age Under 5
In terms of disability age under 5, the demographic groups most similar to Cherokee are Immigrants from Portugal (1.8%, a difference of 1.3%), Chickasaw (1.7%, a difference of 1.8%), Sioux (1.8%, a difference of 2.8%), German (1.7%, a difference of 2.9%), and Osage (1.8%, a difference of 3.2%).
| Demographics | Rating | Rank | Disability Age Under 5 |
| French | 0.0 /100 | #317 | Tragic 1.7% |
| Irish | 0.0 /100 | #318 | Tragic 1.7% |
| Slovaks | 0.0 /100 | #319 | Tragic 1.7% |
| Scotch-Irish | 0.0 /100 | #320 | Tragic 1.7% |
| Ottawa | 0.0 /100 | #321 | Tragic 1.7% |
| Germans | 0.0 /100 | #322 | Tragic 1.7% |
| Chickasaw | 0.0 /100 | #323 | Tragic 1.7% |
| Cherokee | 0.0 /100 | #324 | Tragic 1.8% |
| Immigrants | Portugal | 0.0 /100 | #325 | Tragic 1.8% |
| Sioux | 0.0 /100 | #326 | Tragic 1.8% |
| Osage | 0.0 /100 | #327 | Tragic 1.8% |
| Americans | 0.0 /100 | #328 | Tragic 1.9% |
| Houma | 0.0 /100 | #329 | Tragic 1.9% |
| Choctaw | 0.0 /100 | #330 | Tragic 1.9% |
| French Canadians | 0.0 /100 | #331 | Tragic 1.9% |