Immigrants from Argentina vs Scandinavian Unemployment Among Ages 30 to 34 years
COMPARE
Immigrants from Argentina
Scandinavian
Unemployment Among Ages 30 to 34 years
Unemployment Among Ages 30 to 34 years Comparison
Immigrants from Argentina
Scandinavians
5.2%
UNEMPLOYMENT AMONG AGES 30 TO 34 YEARS
92.5/ 100
METRIC RATING
92nd/ 347
METRIC RANK
5.2%
UNEMPLOYMENT AMONG AGES 30 TO 34 YEARS
95.6/ 100
METRIC RATING
76th/ 347
METRIC RANK
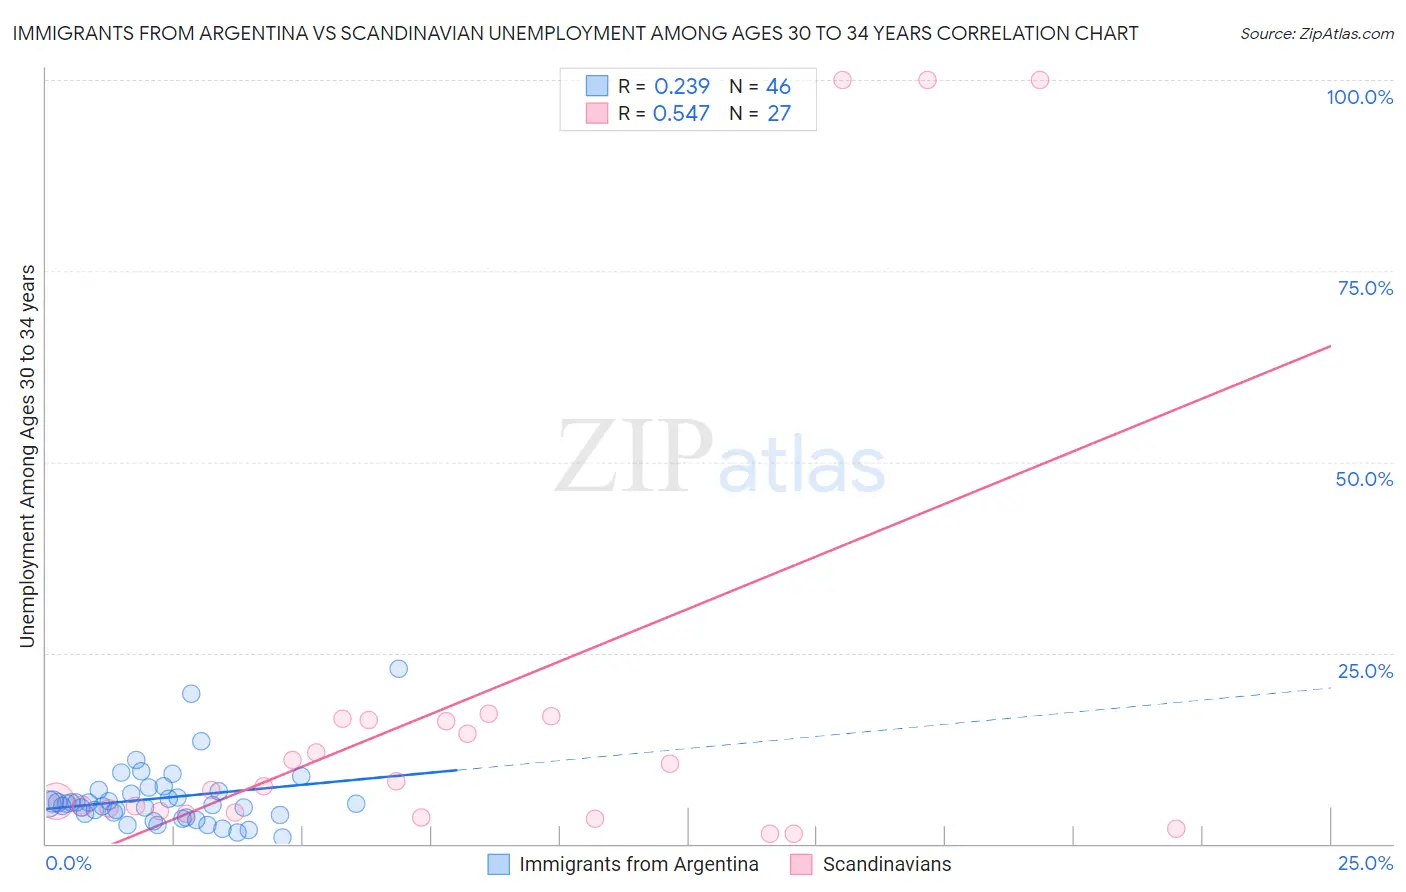
Immigrants from Argentina vs Scandinavian Unemployment Among Ages 30 to 34 years Correlation Chart
The statistical analysis conducted on geographies consisting of 255,363,954 people shows a weak positive correlation between the proportion of Immigrants from Argentina and unemployment rate among population between the ages 30 and 34 in the United States with a correlation coefficient (R) of 0.239 and weighted average of 5.2%. Similarly, the statistical analysis conducted on geographies consisting of 427,904,410 people shows a substantial positive correlation between the proportion of Scandinavians and unemployment rate among population between the ages 30 and 34 in the United States with a correlation coefficient (R) of 0.547 and weighted average of 5.2%, a difference of 1.0%.
Unemployment Among Ages 30 to 34 years Correlation Summary
| Measurement | Immigrants from Argentina | Scandinavian |
| Minimum | 0.90% | 1.3% |
| Maximum | 22.9% | 100.0% |
| Range | 22.0% | 98.7% |
| Mean | 6.0% | 18.4% |
| Median | 5.2% | 7.6% |
| Interquartile 25% (IQ1) | 3.8% | 4.1% |
| Interquartile 75% (IQ3) | 6.9% | 16.2% |
| Interquartile Range (IQR) | 3.1% | 12.0% |
| Standard Deviation (Sample) | 4.1% | 29.8% |
| Standard Deviation (Population) | 4.1% | 29.3% |
Demographics Similar to Immigrants from Argentina and Scandinavians by Unemployment Among Ages 30 to 34 years
In terms of unemployment among ages 30 to 34 years, the demographic groups most similar to Immigrants from Argentina are Iraqi (5.2%, a difference of 0.020%), Laotian (5.2%, a difference of 0.050%), Maltese (5.2%, a difference of 0.050%), Immigrants from Romania (5.2%, a difference of 0.070%), and Immigrants from Sweden (5.2%, a difference of 0.21%). Similarly, the demographic groups most similar to Scandinavians are Uruguayan (5.2%, a difference of 0.070%), Indonesian (5.2%, a difference of 0.20%), Iranian (5.2%, a difference of 0.21%), Immigrants from Lithuania (5.2%, a difference of 0.25%), and Immigrants from Asia (5.2%, a difference of 0.27%).
| Demographics | Rating | Rank | Unemployment Among Ages 30 to 34 years |
| Immigrants | Asia | 96.2 /100 | #74 | Exceptional 5.2% |
| Iranians | 96.0 /100 | #75 | Exceptional 5.2% |
| Scandinavians | 95.6 /100 | #76 | Exceptional 5.2% |
| Uruguayans | 95.4 /100 | #77 | Exceptional 5.2% |
| Indonesians | 95.1 /100 | #78 | Exceptional 5.2% |
| Immigrants | Lithuania | 95.0 /100 | #79 | Exceptional 5.2% |
| Immigrants | Indonesia | 94.7 /100 | #80 | Exceptional 5.2% |
| Chileans | 94.4 /100 | #81 | Exceptional 5.2% |
| Immigrants | Latvia | 94.2 /100 | #82 | Exceptional 5.2% |
| Immigrants | Korea | 94.1 /100 | #83 | Exceptional 5.2% |
| Immigrants | Uganda | 94.0 /100 | #84 | Exceptional 5.2% |
| Immigrants | Egypt | 93.9 /100 | #85 | Exceptional 5.2% |
| Immigrants | Australia | 93.5 /100 | #86 | Exceptional 5.2% |
| Bhutanese | 93.5 /100 | #87 | Exceptional 5.2% |
| Immigrants | Kenya | 93.3 /100 | #88 | Exceptional 5.2% |
| Immigrants | Sweden | 93.3 /100 | #89 | Exceptional 5.2% |
| Immigrants | Romania | 92.8 /100 | #90 | Exceptional 5.2% |
| Iraqis | 92.6 /100 | #91 | Exceptional 5.2% |
| Immigrants | Argentina | 92.5 /100 | #92 | Exceptional 5.2% |
| Laotians | 92.4 /100 | #93 | Exceptional 5.2% |
| Maltese | 92.3 /100 | #94 | Exceptional 5.2% |