Immigrants from Argentina vs Immigrants from Zimbabwe Disability Age Under 5
COMPARE
Immigrants from Argentina
Immigrants from Zimbabwe
Disability Age Under 5
Disability Age Under 5 Comparison
Immigrants from Argentina
Immigrants from Zimbabwe
1.2%
DISABILITY AGE UNDER 5
60.2/ 100
METRIC RATING
167th/ 347
METRIC RANK
1.2%
DISABILITY AGE UNDER 5
77.9/ 100
METRIC RATING
145th/ 347
METRIC RANK
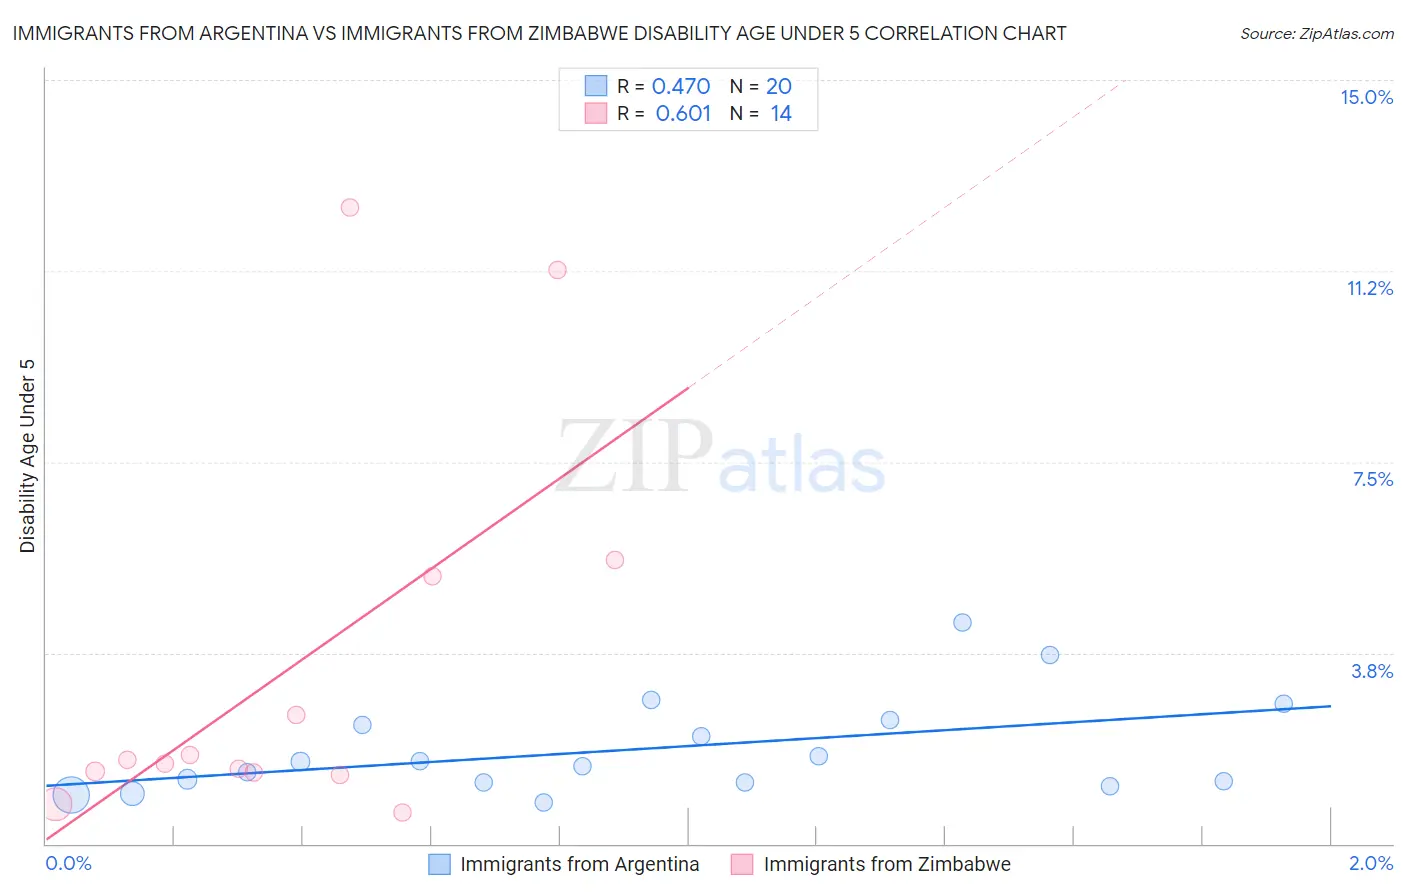
Immigrants from Argentina vs Immigrants from Zimbabwe Disability Age Under 5 Correlation Chart
The statistical analysis conducted on geographies consisting of 162,990,618 people shows a moderate positive correlation between the proportion of Immigrants from Argentina and percentage of population with a disability under the age of 5 in the United States with a correlation coefficient (R) of 0.470 and weighted average of 1.2%. Similarly, the statistical analysis conducted on geographies consisting of 89,065,062 people shows a significant positive correlation between the proportion of Immigrants from Zimbabwe and percentage of population with a disability under the age of 5 in the United States with a correlation coefficient (R) of 0.601 and weighted average of 1.2%, a difference of 2.0%.
Disability Age Under 5 Correlation Summary
| Measurement | Immigrants from Argentina | Immigrants from Zimbabwe |
| Minimum | 0.80% | 0.62% |
| Maximum | 4.3% | 12.5% |
| Range | 3.5% | 11.9% |
| Mean | 1.9% | 3.5% |
| Median | 1.6% | 1.6% |
| Interquartile 25% (IQ1) | 1.2% | 1.4% |
| Interquartile 75% (IQ3) | 2.4% | 5.2% |
| Interquartile Range (IQR) | 1.2% | 3.8% |
| Standard Deviation (Sample) | 0.95% | 3.9% |
| Standard Deviation (Population) | 0.93% | 3.7% |
Similar Demographics by Disability Age Under 5
Demographics Similar to Immigrants from Argentina by Disability Age Under 5
In terms of disability age under 5, the demographic groups most similar to Immigrants from Argentina are Immigrants from Central America (1.2%, a difference of 0.11%), Sierra Leonean (1.2%, a difference of 0.11%), Immigrants from Uruguay (1.2%, a difference of 0.12%), Immigrants from Jamaica (1.2%, a difference of 0.13%), and Immigrants from Kuwait (1.2%, a difference of 0.22%).
| Demographics | Rating | Rank | Disability Age Under 5 |
| Immigrants | Latin America | 65.8 /100 | #160 | Good 1.2% |
| Immigrants | Africa | 65.1 /100 | #161 | Good 1.2% |
| Guatemalans | 63.6 /100 | #162 | Good 1.2% |
| Immigrants | Guatemala | 63.2 /100 | #163 | Good 1.2% |
| Laotians | 62.8 /100 | #164 | Good 1.2% |
| Immigrants | Kuwait | 62.6 /100 | #165 | Good 1.2% |
| Immigrants | Central America | 61.4 /100 | #166 | Good 1.2% |
| Immigrants | Argentina | 60.2 /100 | #167 | Good 1.2% |
| Sierra Leoneans | 59.1 /100 | #168 | Average 1.2% |
| Immigrants | Uruguay | 59.0 /100 | #169 | Average 1.2% |
| Immigrants | Jamaica | 58.8 /100 | #170 | Average 1.2% |
| Guamanians/Chamorros | 57.8 /100 | #171 | Average 1.2% |
| Crow | 51.0 /100 | #172 | Average 1.2% |
| Immigrants | Ireland | 50.3 /100 | #173 | Average 1.2% |
| Immigrants | Latvia | 50.0 /100 | #174 | Average 1.2% |
Demographics Similar to Immigrants from Zimbabwe by Disability Age Under 5
In terms of disability age under 5, the demographic groups most similar to Immigrants from Zimbabwe are Samoan (1.2%, a difference of 0.040%), Immigrants from Middle Africa (1.2%, a difference of 0.18%), Immigrants from Colombia (1.2%, a difference of 0.19%), Alsatian (1.2%, a difference of 0.19%), and Icelander (1.2%, a difference of 0.21%).
| Demographics | Rating | Rank | Disability Age Under 5 |
| Immigrants | Czechoslovakia | 82.8 /100 | #138 | Excellent 1.2% |
| New Zealanders | 81.4 /100 | #139 | Excellent 1.2% |
| Somalis | 80.8 /100 | #140 | Excellent 1.2% |
| Immigrants | Honduras | 80.4 /100 | #141 | Excellent 1.2% |
| Immigrants | Colombia | 79.3 /100 | #142 | Good 1.2% |
| Alsatians | 79.3 /100 | #143 | Good 1.2% |
| Immigrants | Middle Africa | 79.3 /100 | #144 | Good 1.2% |
| Immigrants | Zimbabwe | 77.9 /100 | #145 | Good 1.2% |
| Samoans | 77.7 /100 | #146 | Good 1.2% |
| Icelanders | 76.3 /100 | #147 | Good 1.2% |
| Ghanaians | 76.3 /100 | #148 | Good 1.2% |
| Kenyans | 75.9 /100 | #149 | Good 1.2% |
| South Americans | 75.6 /100 | #150 | Good 1.2% |
| Yaqui | 74.8 /100 | #151 | Good 1.2% |
| Hondurans | 72.5 /100 | #152 | Good 1.2% |