Immigrants from Argentina vs Dutch Associate's Degree
COMPARE
Immigrants from Argentina
Dutch
Associate's Degree
Associate's Degree Comparison
Immigrants from Argentina
Dutch
50.9%
ASSOCIATE'S DEGREE
99.5/ 100
METRIC RATING
70th/ 347
METRIC RANK
45.0%
ASSOCIATE'S DEGREE
17.6/ 100
METRIC RATING
208th/ 347
METRIC RANK
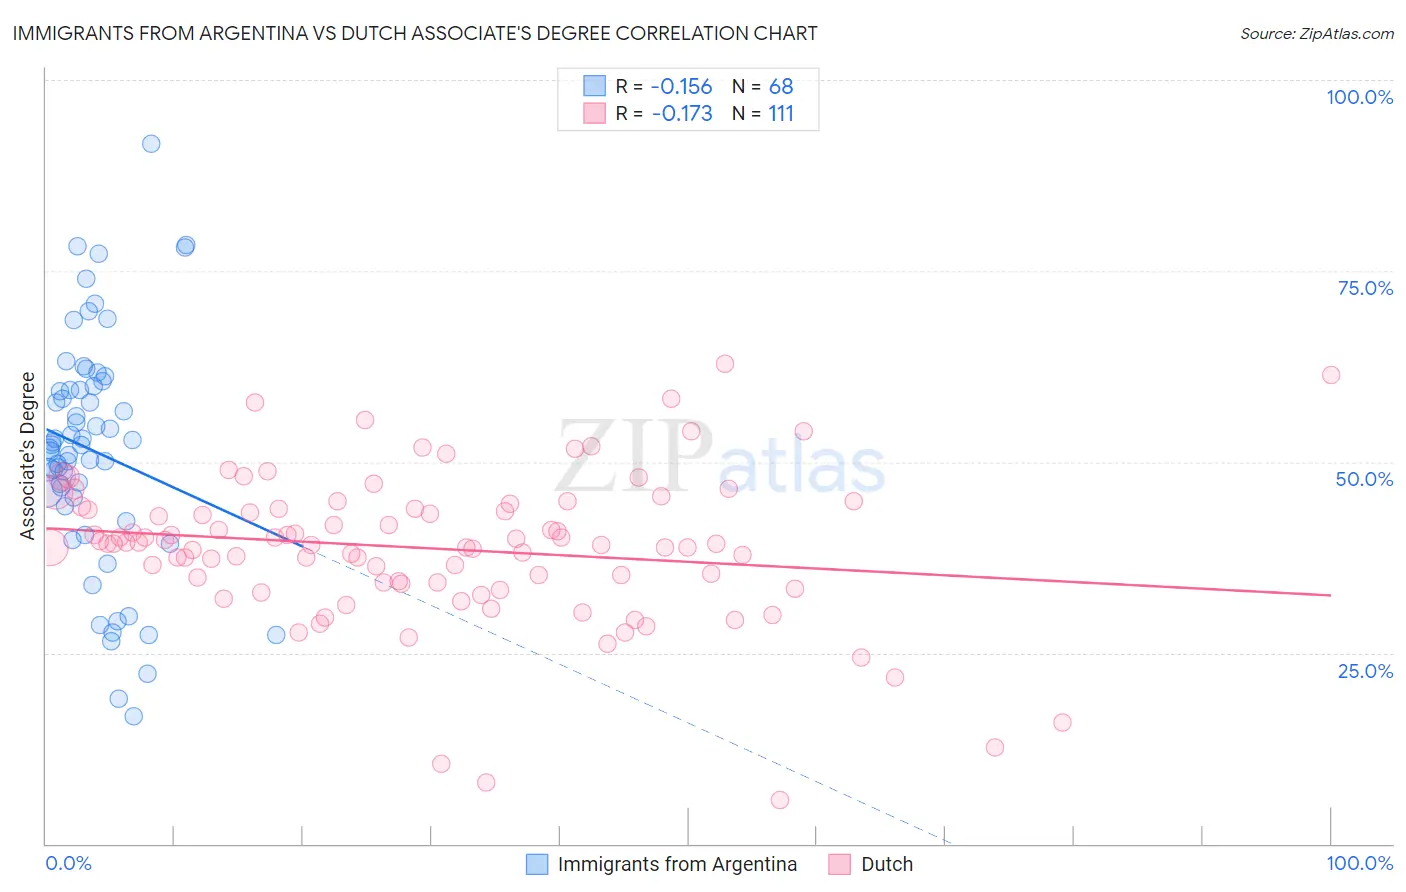
Immigrants from Argentina vs Dutch Associate's Degree Correlation Chart
The statistical analysis conducted on geographies consisting of 264,422,304 people shows a poor negative correlation between the proportion of Immigrants from Argentina and percentage of population with at least associate's degree education in the United States with a correlation coefficient (R) of -0.156 and weighted average of 50.9%. Similarly, the statistical analysis conducted on geographies consisting of 554,303,410 people shows a poor negative correlation between the proportion of Dutch and percentage of population with at least associate's degree education in the United States with a correlation coefficient (R) of -0.173 and weighted average of 45.0%, a difference of 13.1%.
Associate's Degree Correlation Summary
| Measurement | Immigrants from Argentina | Dutch |
| Minimum | 16.7% | 5.7% |
| Maximum | 91.7% | 62.9% |
| Range | 75.0% | 57.2% |
| Mean | 51.4% | 38.7% |
| Median | 52.3% | 39.3% |
| Interquartile 25% (IQ1) | 44.7% | 34.2% |
| Interquartile 75% (IQ3) | 59.7% | 43.9% |
| Interquartile Range (IQR) | 15.0% | 9.8% |
| Standard Deviation (Sample) | 15.2% | 9.9% |
| Standard Deviation (Population) | 15.1% | 9.8% |
Similar Demographics by Associate's Degree
Demographics Similar to Immigrants from Argentina by Associate's Degree
In terms of associate's degree, the demographic groups most similar to Immigrants from Argentina are Immigrants from Romania (50.9%, a difference of 0.010%), Egyptian (50.9%, a difference of 0.030%), Immigrants from Pakistan (50.9%, a difference of 0.070%), Immigrants from Indonesia (51.0%, a difference of 0.15%), and Carpatho Rusyn (50.6%, a difference of 0.54%).
| Demographics | Rating | Rank | Associate's Degree |
| South Africans | 99.7 /100 | #63 | Exceptional 51.4% |
| Immigrants | Netherlands | 99.7 /100 | #64 | Exceptional 51.4% |
| Zimbabweans | 99.7 /100 | #65 | Exceptional 51.3% |
| Immigrants | Europe | 99.7 /100 | #66 | Exceptional 51.3% |
| Argentineans | 99.6 /100 | #67 | Exceptional 51.2% |
| Immigrants | Indonesia | 99.5 /100 | #68 | Exceptional 51.0% |
| Egyptians | 99.5 /100 | #69 | Exceptional 50.9% |
| Immigrants | Argentina | 99.5 /100 | #70 | Exceptional 50.9% |
| Immigrants | Romania | 99.5 /100 | #71 | Exceptional 50.9% |
| Immigrants | Pakistan | 99.5 /100 | #72 | Exceptional 50.9% |
| Carpatho Rusyns | 99.3 /100 | #73 | Exceptional 50.6% |
| Lithuanians | 99.3 /100 | #74 | Exceptional 50.6% |
| Immigrants | Scotland | 99.3 /100 | #75 | Exceptional 50.6% |
| Immigrants | Zimbabwe | 99.2 /100 | #76 | Exceptional 50.5% |
| Immigrants | Lebanon | 99.1 /100 | #77 | Exceptional 50.5% |
Demographics Similar to Dutch by Associate's Degree
In terms of associate's degree, the demographic groups most similar to Dutch are Panamanian (45.1%, a difference of 0.10%), Immigrants from Costa Rica (45.0%, a difference of 0.11%), Immigrants from Philippines (45.0%, a difference of 0.12%), Immigrants from Zaire (45.0%, a difference of 0.13%), and Immigrants from Thailand (45.1%, a difference of 0.17%).
| Demographics | Rating | Rank | Associate's Degree |
| Immigrants | Vietnam | 20.8 /100 | #201 | Fair 45.2% |
| Spaniards | 20.4 /100 | #202 | Fair 45.2% |
| Immigrants | South Eastern Asia | 20.2 /100 | #203 | Fair 45.2% |
| Nigerians | 19.1 /100 | #204 | Poor 45.1% |
| Immigrants | Thailand | 18.9 /100 | #205 | Poor 45.1% |
| German Russians | 18.9 /100 | #206 | Poor 45.1% |
| Panamanians | 18.4 /100 | #207 | Poor 45.1% |
| Dutch | 17.6 /100 | #208 | Poor 45.0% |
| Immigrants | Costa Rica | 16.7 /100 | #209 | Poor 45.0% |
| Immigrants | Philippines | 16.7 /100 | #210 | Poor 45.0% |
| Immigrants | Zaire | 16.6 /100 | #211 | Poor 45.0% |
| French Canadians | 15.0 /100 | #212 | Poor 44.9% |
| Immigrants | Ghana | 14.2 /100 | #213 | Poor 44.8% |
| Immigrants | Middle Africa | 12.7 /100 | #214 | Poor 44.7% |
| Immigrants | Panama | 12.4 /100 | #215 | Poor 44.7% |