Immigrants from Albania vs Immigrants from Kazakhstan Disability Age Under 5
COMPARE
Immigrants from Albania
Immigrants from Kazakhstan
Disability Age Under 5
Disability Age Under 5 Comparison
Immigrants from Albania
Immigrants from Kazakhstan
1.1%
DISABILITY AGE UNDER 5
99.9/ 100
METRIC RATING
40th/ 347
METRIC RANK
1.1%
DISABILITY AGE UNDER 5
99.7/ 100
METRIC RATING
51st/ 347
METRIC RANK
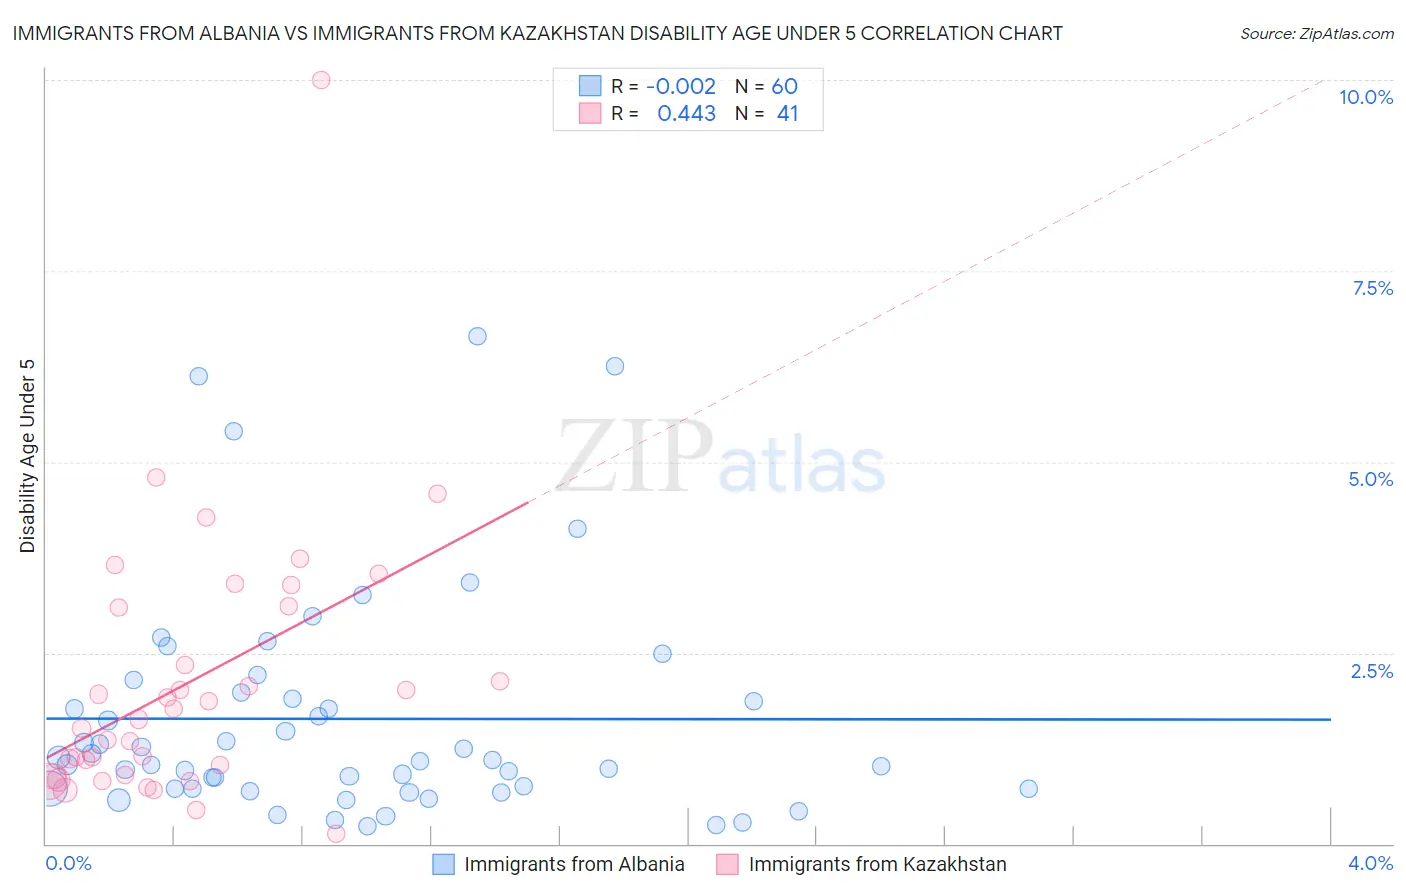
Immigrants from Albania vs Immigrants from Kazakhstan Disability Age Under 5 Correlation Chart
The statistical analysis conducted on geographies consisting of 82,683,996 people shows no correlation between the proportion of Immigrants from Albania and percentage of population with a disability under the age of 5 in the United States with a correlation coefficient (R) of -0.002 and weighted average of 1.1%. Similarly, the statistical analysis conducted on geographies consisting of 91,439,887 people shows a moderate positive correlation between the proportion of Immigrants from Kazakhstan and percentage of population with a disability under the age of 5 in the United States with a correlation coefficient (R) of 0.443 and weighted average of 1.1%, a difference of 2.0%.
Disability Age Under 5 Correlation Summary
| Measurement | Immigrants from Albania | Immigrants from Kazakhstan |
| Minimum | 0.23% | 0.14% |
| Maximum | 6.6% | 10.0% |
| Range | 6.4% | 9.9% |
| Mean | 1.6% | 2.1% |
| Median | 1.1% | 1.6% |
| Interquartile 25% (IQ1) | 0.72% | 0.89% |
| Interquartile 75% (IQ3) | 1.9% | 3.1% |
| Interquartile Range (IQR) | 1.2% | 2.2% |
| Standard Deviation (Sample) | 1.5% | 1.8% |
| Standard Deviation (Population) | 1.5% | 1.7% |
Demographics Similar to Immigrants from Albania and Immigrants from Kazakhstan by Disability Age Under 5
In terms of disability age under 5, the demographic groups most similar to Immigrants from Albania are Filipino (1.1%, a difference of 0.33%), Thai (1.1%, a difference of 0.41%), Immigrants from Bulgaria (1.1%, a difference of 0.51%), Pima (1.1%, a difference of 0.52%), and Immigrants from Asia (1.1%, a difference of 0.61%). Similarly, the demographic groups most similar to Immigrants from Kazakhstan are Immigrants from Japan (1.1%, a difference of 0.19%), Immigrants from Russia (1.1%, a difference of 0.20%), Immigrants from Singapore (1.1%, a difference of 0.41%), Immigrants from Bolivia (1.1%, a difference of 0.42%), and Immigrants from Sweden (1.1%, a difference of 0.63%).
| Demographics | Rating | Rank | Disability Age Under 5 |
| Barbadians | 99.9 /100 | #35 | Exceptional 1.0% |
| Immigrants | Nepal | 99.9 /100 | #36 | Exceptional 1.0% |
| Immigrants | India | 99.9 /100 | #37 | Exceptional 1.0% |
| Immigrants | Guyana | 99.9 /100 | #38 | Exceptional 1.0% |
| Filipinos | 99.9 /100 | #39 | Exceptional 1.1% |
| Immigrants | Albania | 99.9 /100 | #40 | Exceptional 1.1% |
| Thais | 99.8 /100 | #41 | Exceptional 1.1% |
| Immigrants | Bulgaria | 99.8 /100 | #42 | Exceptional 1.1% |
| Pima | 99.8 /100 | #43 | Exceptional 1.1% |
| Immigrants | Asia | 99.8 /100 | #44 | Exceptional 1.1% |
| Immigrants | Turkey | 99.8 /100 | #45 | Exceptional 1.1% |
| Immigrants | Congo | 99.8 /100 | #46 | Exceptional 1.1% |
| Immigrants | Sweden | 99.8 /100 | #47 | Exceptional 1.1% |
| Immigrants | Singapore | 99.7 /100 | #48 | Exceptional 1.1% |
| Immigrants | Russia | 99.7 /100 | #49 | Exceptional 1.1% |
| Immigrants | Japan | 99.7 /100 | #50 | Exceptional 1.1% |
| Immigrants | Kazakhstan | 99.7 /100 | #51 | Exceptional 1.1% |
| Immigrants | Bolivia | 99.6 /100 | #52 | Exceptional 1.1% |
| Asians | 99.6 /100 | #53 | Exceptional 1.1% |
| Immigrants | El Salvador | 99.6 /100 | #54 | Exceptional 1.1% |
| Salvadorans | 99.5 /100 | #55 | Exceptional 1.1% |