Hungarian vs Immigrants from the Azores Householder Income Ages 45 - 64 years
COMPARE
Hungarian
Immigrants from the Azores
Householder Income Ages 45 - 64 years
Householder Income Ages 45 - 64 years Comparison
Hungarians
Immigrants from the Azores
$103,913
HOUSEHOLDER INCOME AGES 45 - 64 YEARS
85.8/ 100
METRIC RATING
137th/ 347
METRIC RANK
$94,138
HOUSEHOLDER INCOME AGES 45 - 64 YEARS
4.3/ 100
METRIC RATING
226th/ 347
METRIC RANK
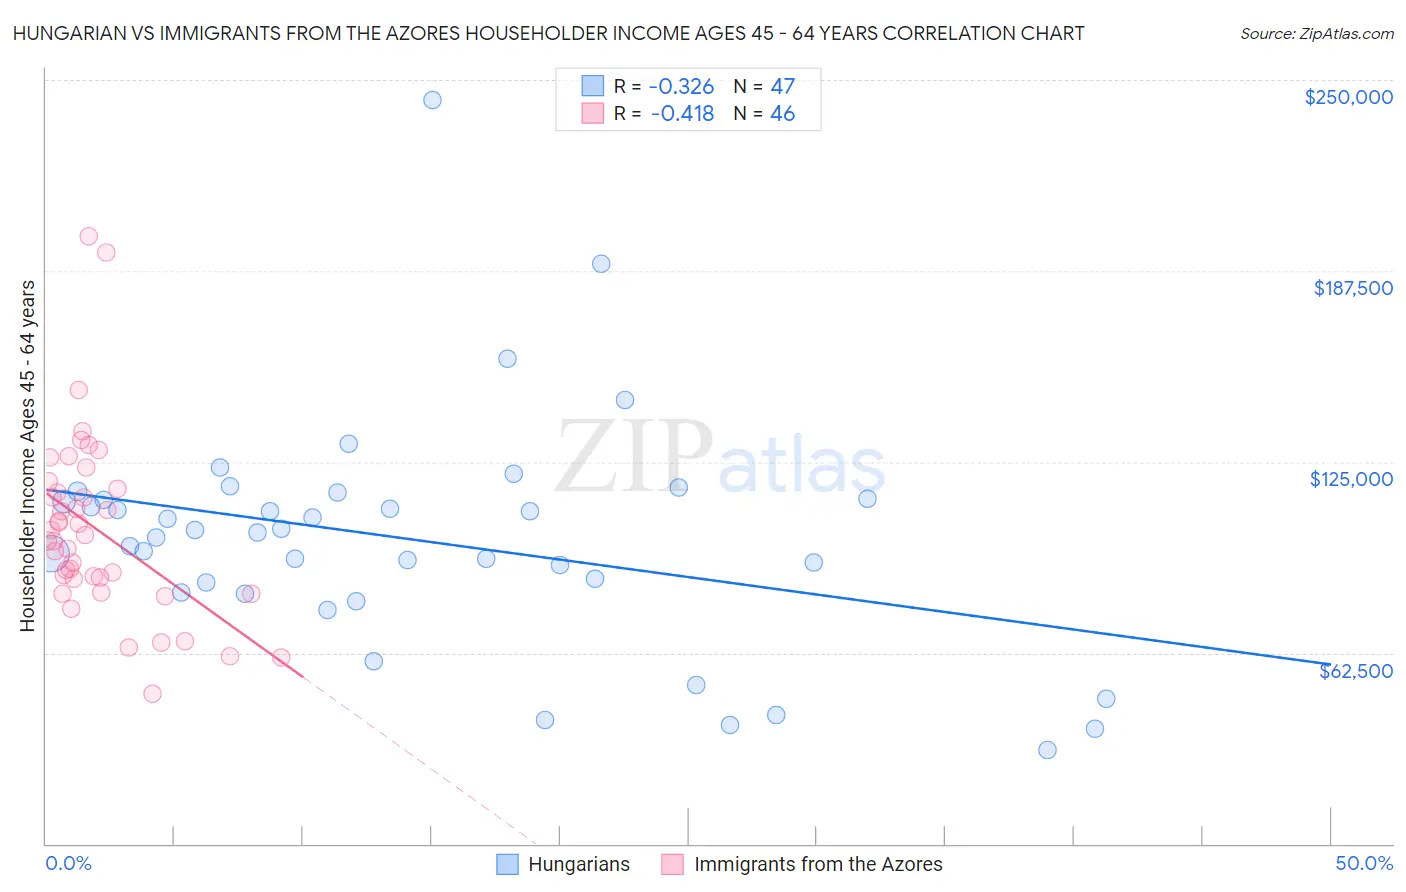
Hungarian vs Immigrants from the Azores Householder Income Ages 45 - 64 years Correlation Chart
The statistical analysis conducted on geographies consisting of 484,921,050 people shows a mild negative correlation between the proportion of Hungarians and household income with householder between the ages 45 and 64 in the United States with a correlation coefficient (R) of -0.326 and weighted average of $103,913. Similarly, the statistical analysis conducted on geographies consisting of 46,245,378 people shows a moderate negative correlation between the proportion of Immigrants from the Azores and household income with householder between the ages 45 and 64 in the United States with a correlation coefficient (R) of -0.418 and weighted average of $94,138, a difference of 10.4%.
Householder Income Ages 45 - 64 years Correlation Summary
| Measurement | Hungarian | Immigrants from the Azores |
| Minimum | $30,798 | $49,083 |
| Maximum | $243,392 | $198,981 |
| Range | $212,594 | $149,898 |
| Mean | $99,450 | $103,017 |
| Median | $101,881 | $100,003 |
| Interquartile 25% (IQ1) | $82,262 | $86,798 |
| Interquartile 75% (IQ3) | $112,938 | $116,103 |
| Interquartile Range (IQR) | $30,676 | $29,305 |
| Standard Deviation (Sample) | $38,021 | $29,838 |
| Standard Deviation (Population) | $37,614 | $29,512 |
Similar Demographics by Householder Income Ages 45 - 64 years
Demographics Similar to Hungarians by Householder Income Ages 45 - 64 years
In terms of householder income ages 45 - 64 years, the demographic groups most similar to Hungarians are Ethiopian ($103,736, a difference of 0.17%), Immigrants from Oceania ($103,705, a difference of 0.20%), Norwegian ($103,682, a difference of 0.22%), Taiwanese ($104,180, a difference of 0.26%), and Immigrants from Uganda ($103,584, a difference of 0.32%).
| Demographics | Rating | Rank | Householder Income Ages 45 - 64 years |
| Immigrants | Zimbabwe | 91.2 /100 | #130 | Exceptional $104,992 |
| Immigrants | Syria | 90.7 /100 | #131 | Exceptional $104,858 |
| Lebanese | 90.1 /100 | #132 | Exceptional $104,734 |
| Arabs | 89.3 /100 | #133 | Excellent $104,566 |
| Canadians | 89.3 /100 | #134 | Excellent $104,560 |
| Brazilians | 88.6 /100 | #135 | Excellent $104,408 |
| Taiwanese | 87.4 /100 | #136 | Excellent $104,180 |
| Hungarians | 85.8 /100 | #137 | Excellent $103,913 |
| Ethiopians | 84.7 /100 | #138 | Excellent $103,736 |
| Immigrants | Oceania | 84.5 /100 | #139 | Excellent $103,705 |
| Norwegians | 84.3 /100 | #140 | Excellent $103,682 |
| Immigrants | Uganda | 83.7 /100 | #141 | Excellent $103,584 |
| Luxembourgers | 83.3 /100 | #142 | Excellent $103,536 |
| Serbians | 83.2 /100 | #143 | Excellent $103,522 |
| Czechs | 83.1 /100 | #144 | Excellent $103,507 |
Demographics Similar to Immigrants from the Azores by Householder Income Ages 45 - 64 years
In terms of householder income ages 45 - 64 years, the demographic groups most similar to Immigrants from the Azores are Bermudan ($94,197, a difference of 0.060%), Immigrants from Bosnia and Herzegovina ($94,288, a difference of 0.16%), Alaska Native ($93,991, a difference of 0.16%), Nonimmigrants ($94,448, a difference of 0.33%), and Immigrants from Panama ($93,815, a difference of 0.34%).
| Demographics | Rating | Rank | Householder Income Ages 45 - 64 years |
| Immigrants | Armenia | 6.1 /100 | #219 | Tragic $94,863 |
| Salvadorans | 6.0 /100 | #220 | Tragic $94,842 |
| Immigrants | Nigeria | 5.9 /100 | #221 | Tragic $94,804 |
| Malaysians | 5.2 /100 | #222 | Tragic $94,517 |
| Immigrants | Nonimmigrants | 5.0 /100 | #223 | Tragic $94,448 |
| Immigrants | Bosnia and Herzegovina | 4.6 /100 | #224 | Tragic $94,288 |
| Bermudans | 4.4 /100 | #225 | Tragic $94,197 |
| Immigrants | Azores | 4.3 /100 | #226 | Tragic $94,138 |
| Alaska Natives | 4.0 /100 | #227 | Tragic $93,991 |
| Immigrants | Panama | 3.7 /100 | #228 | Tragic $93,815 |
| Vietnamese | 3.6 /100 | #229 | Tragic $93,788 |
| Immigrants | Sudan | 3.6 /100 | #230 | Tragic $93,781 |
| Ecuadorians | 3.6 /100 | #231 | Tragic $93,739 |
| Sudanese | 3.5 /100 | #232 | Tragic $93,718 |
| Nepalese | 3.0 /100 | #233 | Tragic $93,355 |