Houma vs Shoshone 6th Grade
COMPARE
Houma
Shoshone
6th Grade
6th Grade Comparison
Houma
Shoshone
96.2%
6TH GRADE
0.1/ 100
METRIC RATING
282nd/ 347
METRIC RANK
97.6%
6TH GRADE
99.0/ 100
METRIC RATING
84th/ 347
METRIC RANK
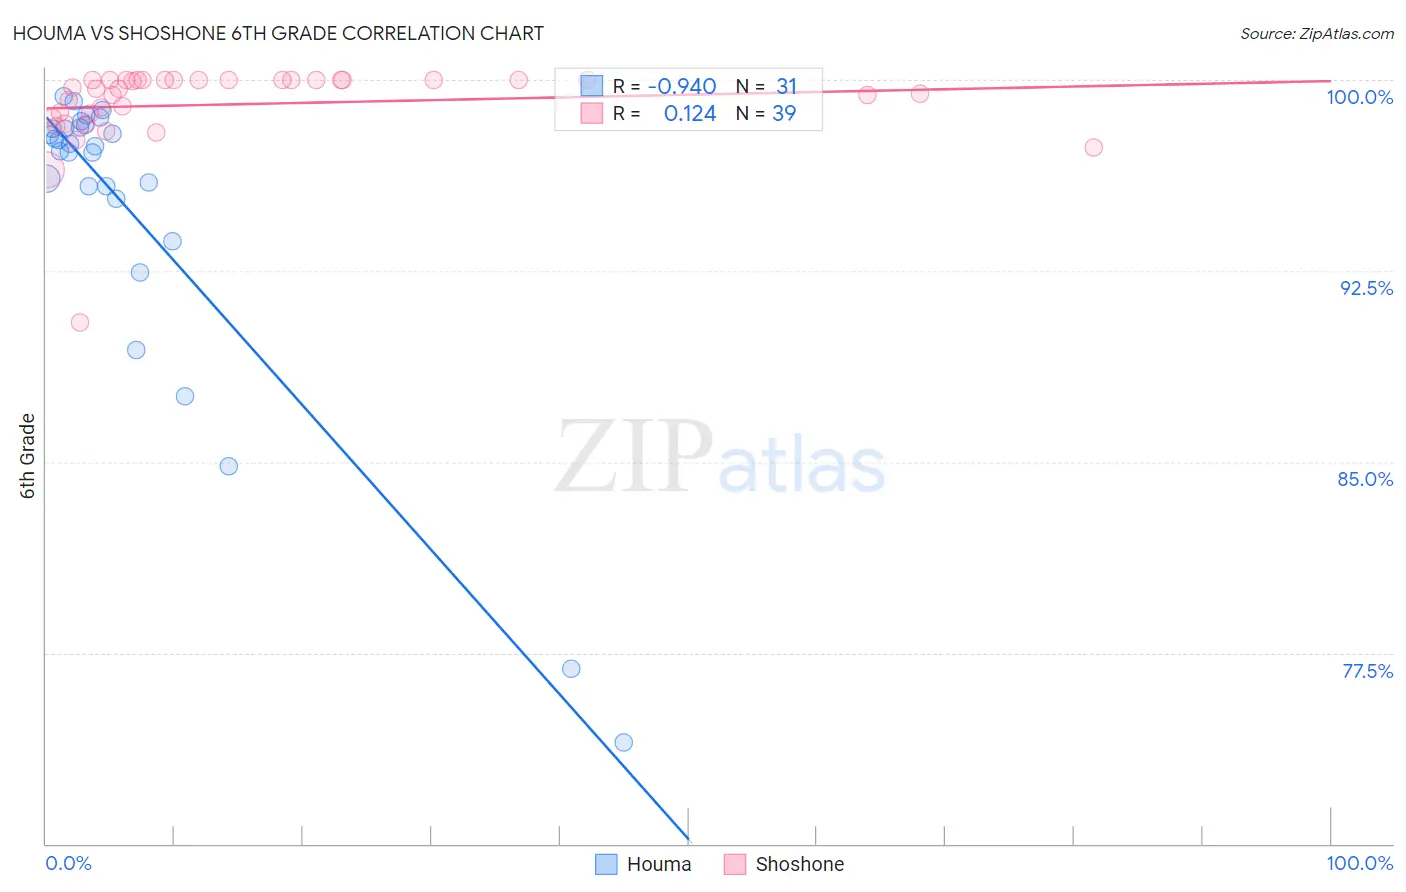
Houma vs Shoshone 6th Grade Correlation Chart
The statistical analysis conducted on geographies consisting of 36,795,916 people shows a near-perfect negative correlation between the proportion of Houma and percentage of population with at least 6th grade education in the United States with a correlation coefficient (R) of -0.940 and weighted average of 96.2%. Similarly, the statistical analysis conducted on geographies consisting of 66,625,086 people shows a poor positive correlation between the proportion of Shoshone and percentage of population with at least 6th grade education in the United States with a correlation coefficient (R) of 0.124 and weighted average of 97.6%, a difference of 1.4%.
6th Grade Correlation Summary
| Measurement | Houma | Shoshone |
| Minimum | 74.0% | 90.5% |
| Maximum | 99.4% | 100.0% |
| Range | 25.4% | 9.5% |
| Mean | 94.9% | 99.0% |
| Median | 97.4% | 99.7% |
| Interquartile 25% (IQ1) | 95.3% | 98.5% |
| Interquartile 75% (IQ3) | 98.1% | 100.0% |
| Interquartile Range (IQR) | 2.8% | 1.5% |
| Standard Deviation (Sample) | 6.2% | 1.7% |
| Standard Deviation (Population) | 6.1% | 1.7% |
Similar Demographics by 6th Grade
Demographics Similar to Houma by 6th Grade
In terms of 6th grade, the demographic groups most similar to Houma are Immigrants from Peru (96.2%, a difference of 0.0%), Immigrants from Afghanistan (96.2%, a difference of 0.0%), Trinidadian and Tobagonian (96.2%, a difference of 0.0%), Cuban (96.2%, a difference of 0.010%), and Immigrants from Western Africa (96.3%, a difference of 0.020%).
| Demographics | Rating | Rank | 6th Grade |
| Immigrants | Ghana | 0.1 /100 | #275 | Tragic 96.3% |
| Yaqui | 0.1 /100 | #276 | Tragic 96.3% |
| Immigrants | Western Africa | 0.1 /100 | #277 | Tragic 96.3% |
| Immigrants | Thailand | 0.1 /100 | #278 | Tragic 96.3% |
| Immigrants | Peru | 0.1 /100 | #279 | Tragic 96.2% |
| Immigrants | Afghanistan | 0.1 /100 | #280 | Tragic 96.2% |
| Trinidadians and Tobagonians | 0.1 /100 | #281 | Tragic 96.2% |
| Houma | 0.1 /100 | #282 | Tragic 96.2% |
| Cubans | 0.1 /100 | #283 | Tragic 96.2% |
| Fijians | 0.1 /100 | #284 | Tragic 96.2% |
| Somalis | 0.1 /100 | #285 | Tragic 96.2% |
| Barbadians | 0.0 /100 | #286 | Tragic 96.2% |
| Immigrants | Trinidad and Tobago | 0.0 /100 | #287 | Tragic 96.2% |
| Malaysians | 0.0 /100 | #288 | Tragic 96.2% |
| Immigrants | Eritrea | 0.0 /100 | #289 | Tragic 96.1% |
Demographics Similar to Shoshone by 6th Grade
In terms of 6th grade, the demographic groups most similar to Shoshone are Zimbabwean (97.6%, a difference of 0.010%), Potawatomi (97.6%, a difference of 0.010%), Delaware (97.6%, a difference of 0.010%), Lumbee (97.6%, a difference of 0.020%), and Immigrants from Belgium (97.5%, a difference of 0.020%).
| Demographics | Rating | Rank | 6th Grade |
| Immigrants | Lithuania | 99.3 /100 | #77 | Exceptional 97.6% |
| Icelanders | 99.3 /100 | #78 | Exceptional 97.6% |
| Immigrants | India | 99.3 /100 | #79 | Exceptional 97.6% |
| Osage | 99.3 /100 | #80 | Exceptional 97.6% |
| Lumbee | 99.2 /100 | #81 | Exceptional 97.6% |
| Zimbabweans | 99.1 /100 | #82 | Exceptional 97.6% |
| Potawatomi | 99.1 /100 | #83 | Exceptional 97.6% |
| Shoshone | 99.0 /100 | #84 | Exceptional 97.6% |
| Delaware | 98.9 /100 | #85 | Exceptional 97.6% |
| Immigrants | Belgium | 98.9 /100 | #86 | Exceptional 97.5% |
| Puget Sound Salish | 98.9 /100 | #87 | Exceptional 97.5% |
| Immigrants | South Africa | 98.9 /100 | #88 | Exceptional 97.5% |
| Immigrants | Australia | 98.8 /100 | #89 | Exceptional 97.5% |
| Pueblo | 98.8 /100 | #90 | Exceptional 97.5% |
| Immigrants | Western Europe | 98.8 /100 | #91 | Exceptional 97.5% |