Immigrants from Sri Lanka vs Shoshone Vision Disability
COMPARE
Immigrants from Sri Lanka
Shoshone
Vision Disability
Vision Disability Comparison
Immigrants from Sri Lanka
Shoshone
1.9%
VISION DISABILITY
100.0/ 100
METRIC RATING
19th/ 347
METRIC RANK
2.7%
VISION DISABILITY
0.0/ 100
METRIC RATING
316th/ 347
METRIC RANK
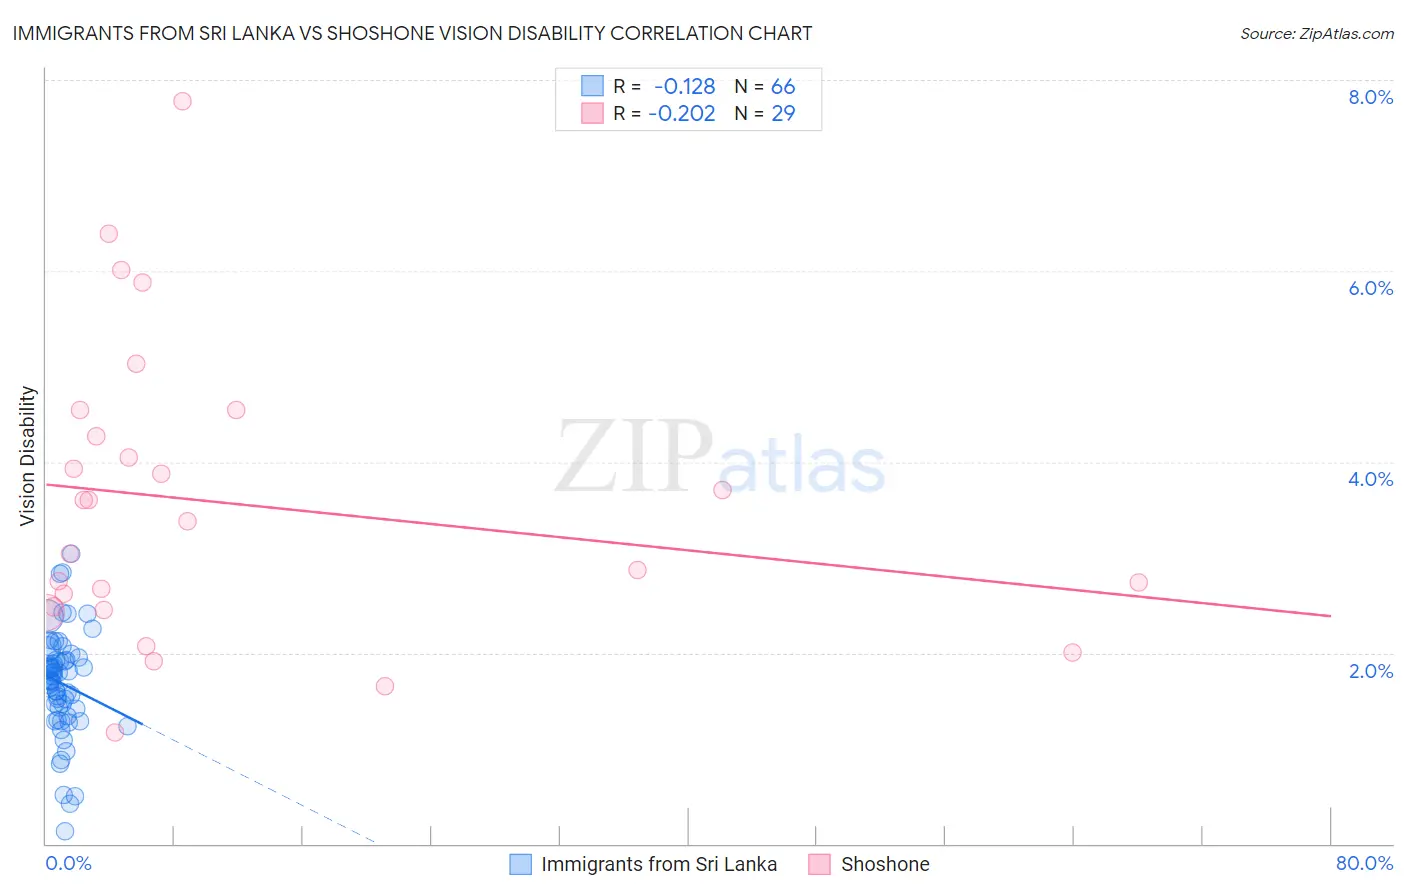
Immigrants from Sri Lanka vs Shoshone Vision Disability Correlation Chart
The statistical analysis conducted on geographies consisting of 149,673,747 people shows a poor negative correlation between the proportion of Immigrants from Sri Lanka and percentage of population with vision disability in the United States with a correlation coefficient (R) of -0.128 and weighted average of 1.9%. Similarly, the statistical analysis conducted on geographies consisting of 66,614,475 people shows a weak negative correlation between the proportion of Shoshone and percentage of population with vision disability in the United States with a correlation coefficient (R) of -0.202 and weighted average of 2.7%, a difference of 43.2%.
Vision Disability Correlation Summary
| Measurement | Immigrants from Sri Lanka | Shoshone |
| Minimum | 0.13% | 1.2% |
| Maximum | 3.0% | 7.8% |
| Range | 2.9% | 6.6% |
| Mean | 1.7% | 3.6% |
| Median | 1.7% | 3.4% |
| Interquartile 25% (IQ1) | 1.4% | 2.5% |
| Interquartile 75% (IQ3) | 1.9% | 4.4% |
| Interquartile Range (IQR) | 0.50% | 1.9% |
| Standard Deviation (Sample) | 0.55% | 1.5% |
| Standard Deviation (Population) | 0.54% | 1.5% |
Similar Demographics by Vision Disability
Demographics Similar to Immigrants from Sri Lanka by Vision Disability
In terms of vision disability, the demographic groups most similar to Immigrants from Sri Lanka are Asian (1.9%, a difference of 1.1%), Bolivian (1.9%, a difference of 1.2%), Turkish (1.9%, a difference of 1.4%), Immigrants from Pakistan (1.9%, a difference of 1.4%), and Indian (Asian) (1.8%, a difference of 1.7%).
| Demographics | Rating | Rank | Vision Disability |
| Immigrants | Korea | 100.0 /100 | #12 | Exceptional 1.8% |
| Immigrants | Eastern Asia | 100.0 /100 | #13 | Exceptional 1.8% |
| Immigrants | China | 100.0 /100 | #14 | Exceptional 1.8% |
| Immigrants | Bolivia | 100.0 /100 | #15 | Exceptional 1.8% |
| Indians (Asian) | 100.0 /100 | #16 | Exceptional 1.8% |
| Burmese | 100.0 /100 | #17 | Exceptional 1.8% |
| Bolivians | 100.0 /100 | #18 | Exceptional 1.9% |
| Immigrants | Sri Lanka | 100.0 /100 | #19 | Exceptional 1.9% |
| Asians | 100.0 /100 | #20 | Exceptional 1.9% |
| Turks | 100.0 /100 | #21 | Exceptional 1.9% |
| Immigrants | Pakistan | 100.0 /100 | #22 | Exceptional 1.9% |
| Immigrants | Asia | 99.9 /100 | #23 | Exceptional 1.9% |
| Immigrants | Lithuania | 99.9 /100 | #24 | Exceptional 1.9% |
| Bulgarians | 99.9 /100 | #25 | Exceptional 1.9% |
| Immigrants | Japan | 99.9 /100 | #26 | Exceptional 1.9% |
Demographics Similar to Shoshone by Vision Disability
In terms of vision disability, the demographic groups most similar to Shoshone are Yup'ik (2.7%, a difference of 0.20%), Osage (2.7%, a difference of 0.43%), Alaska Native (2.7%, a difference of 1.3%), Inupiat (2.7%, a difference of 1.6%), and Potawatomi (2.6%, a difference of 1.7%).
| Demographics | Rating | Rank | Vision Disability |
| Immigrants | Yemen | 0.0 /100 | #309 | Tragic 2.6% |
| Blackfeet | 0.0 /100 | #310 | Tragic 2.6% |
| Dominicans | 0.0 /100 | #311 | Tragic 2.6% |
| Americans | 0.0 /100 | #312 | Tragic 2.6% |
| Potawatomi | 0.0 /100 | #313 | Tragic 2.6% |
| Inupiat | 0.0 /100 | #314 | Tragic 2.7% |
| Osage | 0.0 /100 | #315 | Tragic 2.7% |
| Shoshone | 0.0 /100 | #316 | Tragic 2.7% |
| Yup'ik | 0.0 /100 | #317 | Tragic 2.7% |
| Alaska Natives | 0.0 /100 | #318 | Tragic 2.7% |
| Tohono O'odham | 0.0 /100 | #319 | Tragic 2.8% |
| Blacks/African Americans | 0.0 /100 | #320 | Tragic 2.8% |
| Comanche | 0.0 /100 | #321 | Tragic 2.8% |
| Paiute | 0.0 /100 | #322 | Tragic 2.9% |
| Tlingit-Haida | 0.0 /100 | #323 | Tragic 2.9% |