Immigrants from Greece vs Jordanian Vision Disability
COMPARE
Immigrants from Greece
Jordanian
Vision Disability
Vision Disability Comparison
Immigrants from Greece
Jordanians
2.0%
VISION DISABILITY
99.0/ 100
METRIC RATING
64th/ 347
METRIC RANK
2.0%
VISION DISABILITY
99.2/ 100
METRIC RATING
56th/ 347
METRIC RANK
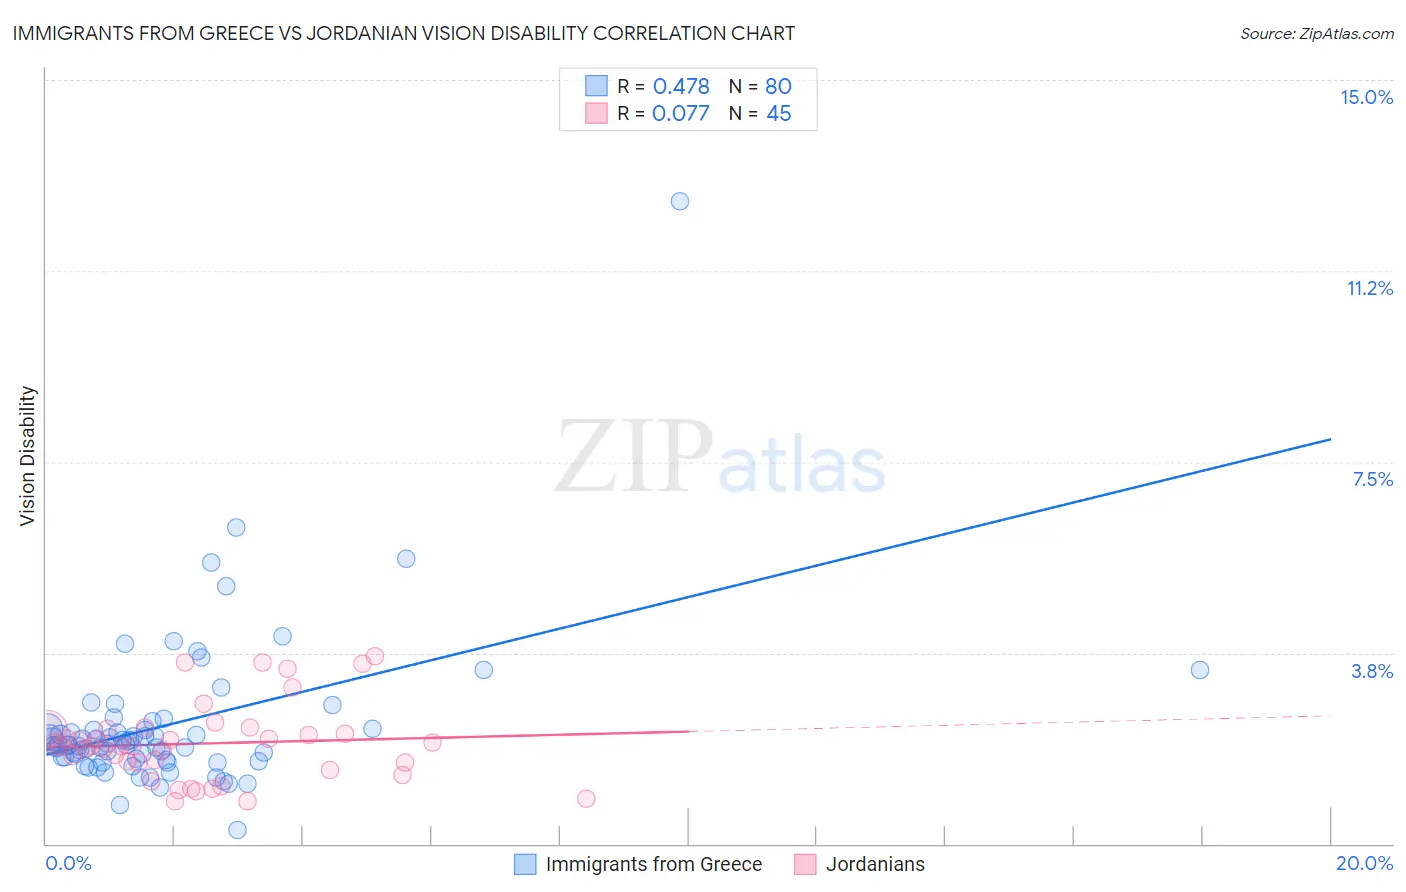
Immigrants from Greece vs Jordanian Vision Disability Correlation Chart
The statistical analysis conducted on geographies consisting of 216,813,822 people shows a moderate positive correlation between the proportion of Immigrants from Greece and percentage of population with vision disability in the United States with a correlation coefficient (R) of 0.478 and weighted average of 2.0%. Similarly, the statistical analysis conducted on geographies consisting of 166,387,634 people shows a slight positive correlation between the proportion of Jordanians and percentage of population with vision disability in the United States with a correlation coefficient (R) of 0.077 and weighted average of 2.0%, a difference of 0.54%.
Vision Disability Correlation Summary
| Measurement | Immigrants from Greece | Jordanian |
| Minimum | 0.27% | 0.83% |
| Maximum | 12.6% | 3.7% |
| Range | 12.3% | 2.8% |
| Mean | 2.3% | 2.0% |
| Median | 1.9% | 1.9% |
| Interquartile 25% (IQ1) | 1.7% | 1.5% |
| Interquartile 75% (IQ3) | 2.3% | 2.3% |
| Interquartile Range (IQR) | 0.60% | 0.74% |
| Standard Deviation (Sample) | 1.6% | 0.75% |
| Standard Deviation (Population) | 1.6% | 0.74% |
Demographics Similar to Immigrants from Greece and Jordanians by Vision Disability
In terms of vision disability, the demographic groups most similar to Immigrants from Greece are Maltese (2.0%, a difference of 0.070%), Armenian (2.0%, a difference of 0.13%), Immigrants from Argentina (2.0%, a difference of 0.13%), Immigrants from Russia (2.0%, a difference of 0.24%), and Immigrants from Northern Africa (2.0%, a difference of 0.24%). Similarly, the demographic groups most similar to Jordanians are Somali (2.0%, a difference of 0.020%), Immigrants from Saudi Arabia (2.0%, a difference of 0.090%), Laotian (2.0%, a difference of 0.17%), Macedonian (2.0%, a difference of 0.22%), and Argentinean (2.0%, a difference of 0.23%).
| Demographics | Rating | Rank | Vision Disability |
| Afghans | 99.5 /100 | #50 | Exceptional 2.0% |
| Tongans | 99.5 /100 | #51 | Exceptional 2.0% |
| Immigrants | Serbia | 99.4 /100 | #52 | Exceptional 2.0% |
| Immigrants | Belarus | 99.3 /100 | #53 | Exceptional 2.0% |
| Macedonians | 99.3 /100 | #54 | Exceptional 2.0% |
| Laotians | 99.3 /100 | #55 | Exceptional 2.0% |
| Jordanians | 99.2 /100 | #56 | Exceptional 2.0% |
| Somalis | 99.2 /100 | #57 | Exceptional 2.0% |
| Immigrants | Saudi Arabia | 99.2 /100 | #58 | Exceptional 2.0% |
| Argentineans | 99.1 /100 | #59 | Exceptional 2.0% |
| Immigrants | Romania | 99.1 /100 | #60 | Exceptional 2.0% |
| Immigrants | Belgium | 99.1 /100 | #61 | Exceptional 2.0% |
| Immigrants | Russia | 99.1 /100 | #62 | Exceptional 2.0% |
| Armenians | 99.0 /100 | #63 | Exceptional 2.0% |
| Immigrants | Greece | 99.0 /100 | #64 | Exceptional 2.0% |
| Maltese | 98.9 /100 | #65 | Exceptional 2.0% |
| Immigrants | Argentina | 98.9 /100 | #66 | Exceptional 2.0% |
| Immigrants | Northern Africa | 98.8 /100 | #67 | Exceptional 2.0% |
| Immigrants | Czechoslovakia | 98.7 /100 | #68 | Exceptional 2.0% |
| Russians | 98.6 /100 | #69 | Exceptional 2.0% |
| Immigrants | Kazakhstan | 98.6 /100 | #70 | Exceptional 2.0% |