Japanese vs Jordanian Vision Disability
COMPARE
Japanese
Jordanian
Vision Disability
Vision Disability Comparison
Japanese
Jordanians
2.4%
VISION DISABILITY
0.3/ 100
METRIC RATING
253rd/ 347
METRIC RANK
2.0%
VISION DISABILITY
99.2/ 100
METRIC RATING
56th/ 347
METRIC RANK
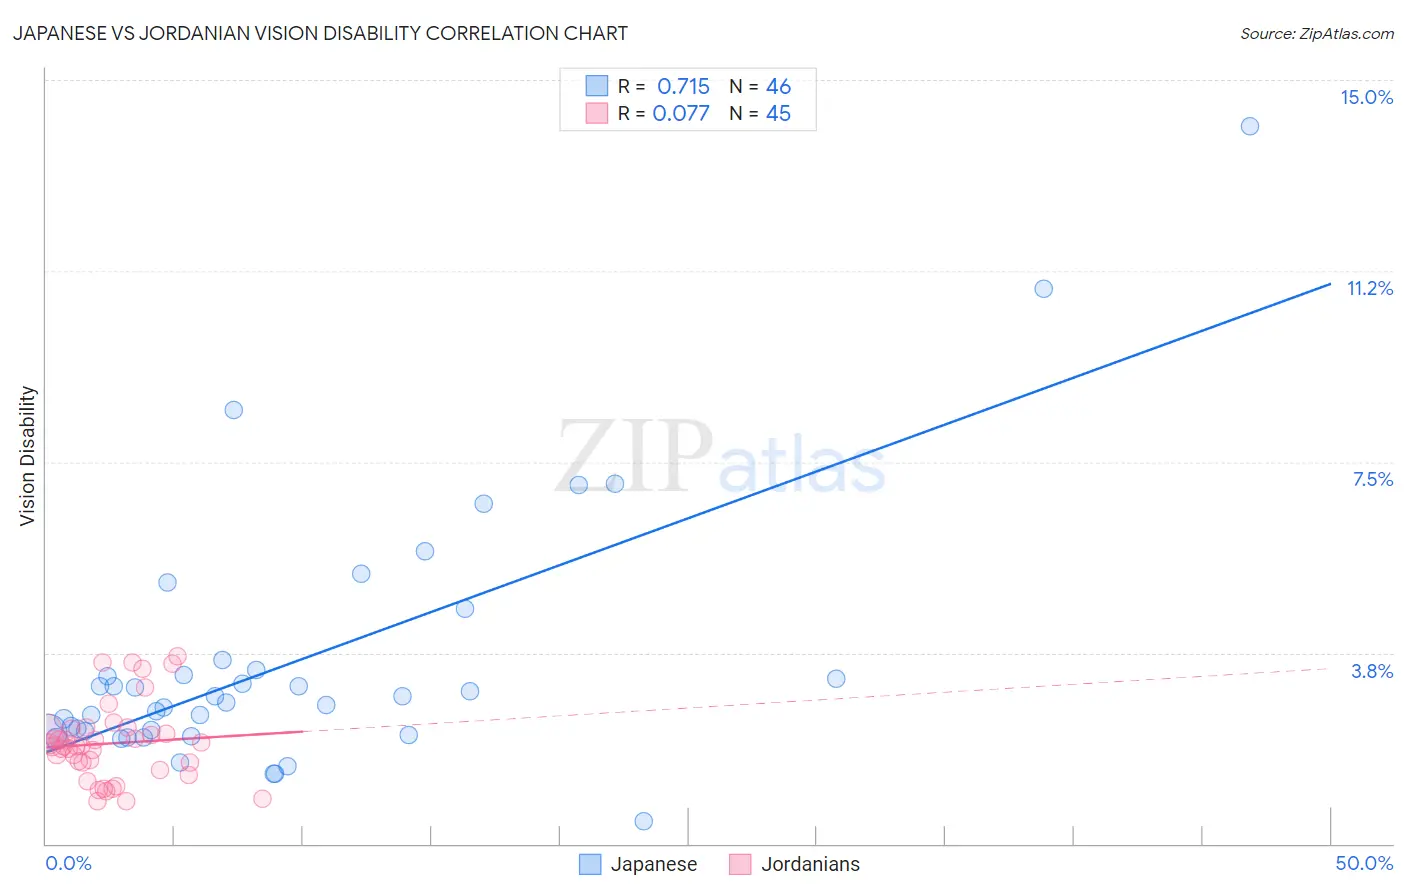
Japanese vs Jordanian Vision Disability Correlation Chart
The statistical analysis conducted on geographies consisting of 249,077,012 people shows a strong positive correlation between the proportion of Japanese and percentage of population with vision disability in the United States with a correlation coefficient (R) of 0.715 and weighted average of 2.4%. Similarly, the statistical analysis conducted on geographies consisting of 166,387,634 people shows a slight positive correlation between the proportion of Jordanians and percentage of population with vision disability in the United States with a correlation coefficient (R) of 0.077 and weighted average of 2.0%, a difference of 18.1%.
Vision Disability Correlation Summary
| Measurement | Japanese | Jordanian |
| Minimum | 0.43% | 0.83% |
| Maximum | 14.1% | 3.7% |
| Range | 13.7% | 2.8% |
| Mean | 3.6% | 2.0% |
| Median | 2.8% | 1.9% |
| Interquartile 25% (IQ1) | 2.2% | 1.5% |
| Interquartile 75% (IQ3) | 3.4% | 2.3% |
| Interquartile Range (IQR) | 1.2% | 0.74% |
| Standard Deviation (Sample) | 2.6% | 0.75% |
| Standard Deviation (Population) | 2.5% | 0.74% |
Similar Demographics by Vision Disability
Demographics Similar to Japanese by Vision Disability
In terms of vision disability, the demographic groups most similar to Japanese are Immigrants from Micronesia (2.4%, a difference of 0.070%), Haitian (2.4%, a difference of 0.28%), Immigrants from Guatemala (2.4%, a difference of 0.31%), Immigrants from Laos (2.4%, a difference of 0.39%), and Bangladeshi (2.3%, a difference of 0.50%).
| Demographics | Rating | Rank | Vision Disability |
| French | 0.5 /100 | #246 | Tragic 2.3% |
| Guatemalans | 0.5 /100 | #247 | Tragic 2.3% |
| Sub-Saharan Africans | 0.5 /100 | #248 | Tragic 2.3% |
| Liberians | 0.5 /100 | #249 | Tragic 2.3% |
| Bangladeshis | 0.5 /100 | #250 | Tragic 2.3% |
| Immigrants | Laos | 0.4 /100 | #251 | Tragic 2.4% |
| Immigrants | Micronesia | 0.3 /100 | #252 | Tragic 2.4% |
| Japanese | 0.3 /100 | #253 | Tragic 2.4% |
| Haitians | 0.3 /100 | #254 | Tragic 2.4% |
| Immigrants | Guatemala | 0.3 /100 | #255 | Tragic 2.4% |
| Immigrants | Haiti | 0.2 /100 | #256 | Tragic 2.4% |
| West Indians | 0.2 /100 | #257 | Tragic 2.4% |
| British West Indians | 0.2 /100 | #258 | Tragic 2.4% |
| Whites/Caucasians | 0.2 /100 | #259 | Tragic 2.4% |
| Belizeans | 0.2 /100 | #260 | Tragic 2.4% |
Demographics Similar to Jordanians by Vision Disability
In terms of vision disability, the demographic groups most similar to Jordanians are Somali (2.0%, a difference of 0.020%), Immigrants from Saudi Arabia (2.0%, a difference of 0.090%), Laotian (2.0%, a difference of 0.17%), Macedonian (2.0%, a difference of 0.22%), and Argentinean (2.0%, a difference of 0.23%).
| Demographics | Rating | Rank | Vision Disability |
| Latvians | 99.5 /100 | #49 | Exceptional 2.0% |
| Afghans | 99.5 /100 | #50 | Exceptional 2.0% |
| Tongans | 99.5 /100 | #51 | Exceptional 2.0% |
| Immigrants | Serbia | 99.4 /100 | #52 | Exceptional 2.0% |
| Immigrants | Belarus | 99.3 /100 | #53 | Exceptional 2.0% |
| Macedonians | 99.3 /100 | #54 | Exceptional 2.0% |
| Laotians | 99.3 /100 | #55 | Exceptional 2.0% |
| Jordanians | 99.2 /100 | #56 | Exceptional 2.0% |
| Somalis | 99.2 /100 | #57 | Exceptional 2.0% |
| Immigrants | Saudi Arabia | 99.2 /100 | #58 | Exceptional 2.0% |
| Argentineans | 99.1 /100 | #59 | Exceptional 2.0% |
| Immigrants | Romania | 99.1 /100 | #60 | Exceptional 2.0% |
| Immigrants | Belgium | 99.1 /100 | #61 | Exceptional 2.0% |
| Immigrants | Russia | 99.1 /100 | #62 | Exceptional 2.0% |
| Armenians | 99.0 /100 | #63 | Exceptional 2.0% |