Houma vs Immigrants from Dominica Disability Age 35 to 64
COMPARE
Houma
Immigrants from Dominica
Disability Age 35 to 64
Disability Age 35 to 64 Comparison
Houma
Immigrants from Dominica
18.7%
DISABILITY AGE 35 TO 64
0.0/ 100
METRIC RATING
347th/ 347
METRIC RANK
12.7%
DISABILITY AGE 35 TO 64
0.2/ 100
METRIC RATING
268th/ 347
METRIC RANK
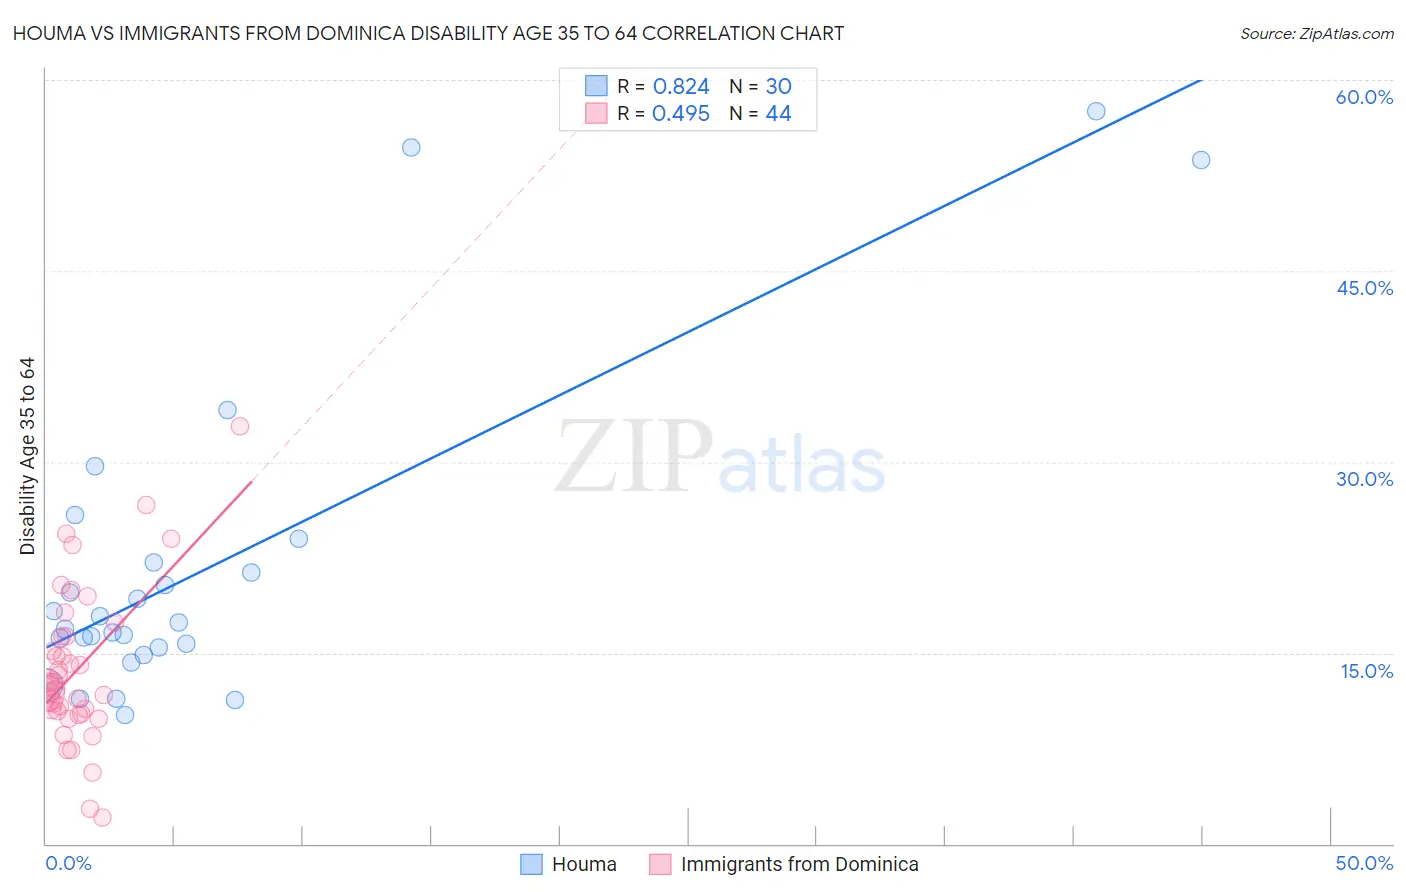
Houma vs Immigrants from Dominica Disability Age 35 to 64 Correlation Chart
The statistical analysis conducted on geographies consisting of 36,789,508 people shows a very strong positive correlation between the proportion of Houma and percentage of population with a disability between the ages 34 and 64 in the United States with a correlation coefficient (R) of 0.824 and weighted average of 18.7%. Similarly, the statistical analysis conducted on geographies consisting of 83,788,429 people shows a moderate positive correlation between the proportion of Immigrants from Dominica and percentage of population with a disability between the ages 34 and 64 in the United States with a correlation coefficient (R) of 0.495 and weighted average of 12.7%, a difference of 47.6%.
Disability Age 35 to 64 Correlation Summary
| Measurement | Houma | Immigrants from Dominica |
| Minimum | 10.2% | 2.1% |
| Maximum | 57.5% | 32.8% |
| Range | 47.3% | 30.7% |
| Mean | 21.7% | 13.7% |
| Median | 17.1% | 12.4% |
| Interquartile 25% (IQ1) | 15.4% | 10.3% |
| Interquartile 75% (IQ3) | 22.1% | 16.3% |
| Interquartile Range (IQR) | 6.7% | 6.0% |
| Standard Deviation (Sample) | 12.6% | 6.1% |
| Standard Deviation (Population) | 12.3% | 6.0% |
Similar Demographics by Disability Age 35 to 64
Demographics Similar to Houma by Disability Age 35 to 64
In terms of disability age 35 to 64, the demographic groups most similar to Houma are Lumbee (17.6%, a difference of 5.9%), Kiowa (17.4%, a difference of 7.7%), Yup'ik (16.9%, a difference of 10.3%), Creek (16.9%, a difference of 10.7%), and Tohono O'odham (16.7%, a difference of 11.6%).
| Demographics | Rating | Rank | Disability Age 35 to 64 |
| Yuman | 0.0 /100 | #333 | Tragic 15.8% |
| Colville | 0.0 /100 | #334 | Tragic 15.8% |
| Seminole | 0.0 /100 | #335 | Tragic 15.9% |
| Menominee | 0.0 /100 | #336 | Tragic 15.9% |
| Puerto Ricans | 0.0 /100 | #337 | Tragic 15.9% |
| Chickasaw | 0.0 /100 | #338 | Tragic 16.1% |
| Pima | 0.0 /100 | #339 | Tragic 16.1% |
| Choctaw | 0.0 /100 | #340 | Tragic 16.4% |
| Tsimshian | 0.0 /100 | #341 | Tragic 16.7% |
| Tohono O'odham | 0.0 /100 | #342 | Tragic 16.7% |
| Creek | 0.0 /100 | #343 | Tragic 16.9% |
| Yup'ik | 0.0 /100 | #344 | Tragic 16.9% |
| Kiowa | 0.0 /100 | #345 | Tragic 17.4% |
| Lumbee | 0.0 /100 | #346 | Tragic 17.6% |
| Houma | 0.0 /100 | #347 | Tragic 18.7% |
Demographics Similar to Immigrants from Dominica by Disability Age 35 to 64
In terms of disability age 35 to 64, the demographic groups most similar to Immigrants from Dominica are Spanish (12.7%, a difference of 0.10%), French (12.7%, a difference of 0.14%), Subsaharan African (12.6%, a difference of 0.18%), White/Caucasian (12.6%, a difference of 0.34%), and Marshallese (12.5%, a difference of 1.1%).
| Demographics | Rating | Rank | Disability Age 35 to 64 |
| Malaysians | 0.5 /100 | #261 | Tragic 12.5% |
| Senegalese | 0.5 /100 | #262 | Tragic 12.5% |
| Immigrants | Zaire | 0.4 /100 | #263 | Tragic 12.5% |
| Immigrants | Portugal | 0.4 /100 | #264 | Tragic 12.5% |
| Marshallese | 0.4 /100 | #265 | Tragic 12.5% |
| Whites/Caucasians | 0.3 /100 | #266 | Tragic 12.6% |
| Sub-Saharan Africans | 0.2 /100 | #267 | Tragic 12.6% |
| Immigrants | Dominica | 0.2 /100 | #268 | Tragic 12.7% |
| Spanish | 0.2 /100 | #269 | Tragic 12.7% |
| French | 0.2 /100 | #270 | Tragic 12.7% |
| Nepalese | 0.1 /100 | #271 | Tragic 12.8% |
| U.S. Virgin Islanders | 0.1 /100 | #272 | Tragic 12.8% |
| Pennsylvania Germans | 0.1 /100 | #273 | Tragic 12.8% |
| Celtics | 0.1 /100 | #274 | Tragic 12.9% |
| Dominicans | 0.1 /100 | #275 | Tragic 12.9% |