Iroquois vs Immigrants from Dominica Disability Age 35 to 64
COMPARE
Iroquois
Immigrants from Dominica
Disability Age 35 to 64
Disability Age 35 to 64 Comparison
Iroquois
Immigrants from Dominica
14.4%
DISABILITY AGE 35 TO 64
0.0/ 100
METRIC RATING
313th/ 347
METRIC RANK
12.7%
DISABILITY AGE 35 TO 64
0.2/ 100
METRIC RATING
268th/ 347
METRIC RANK
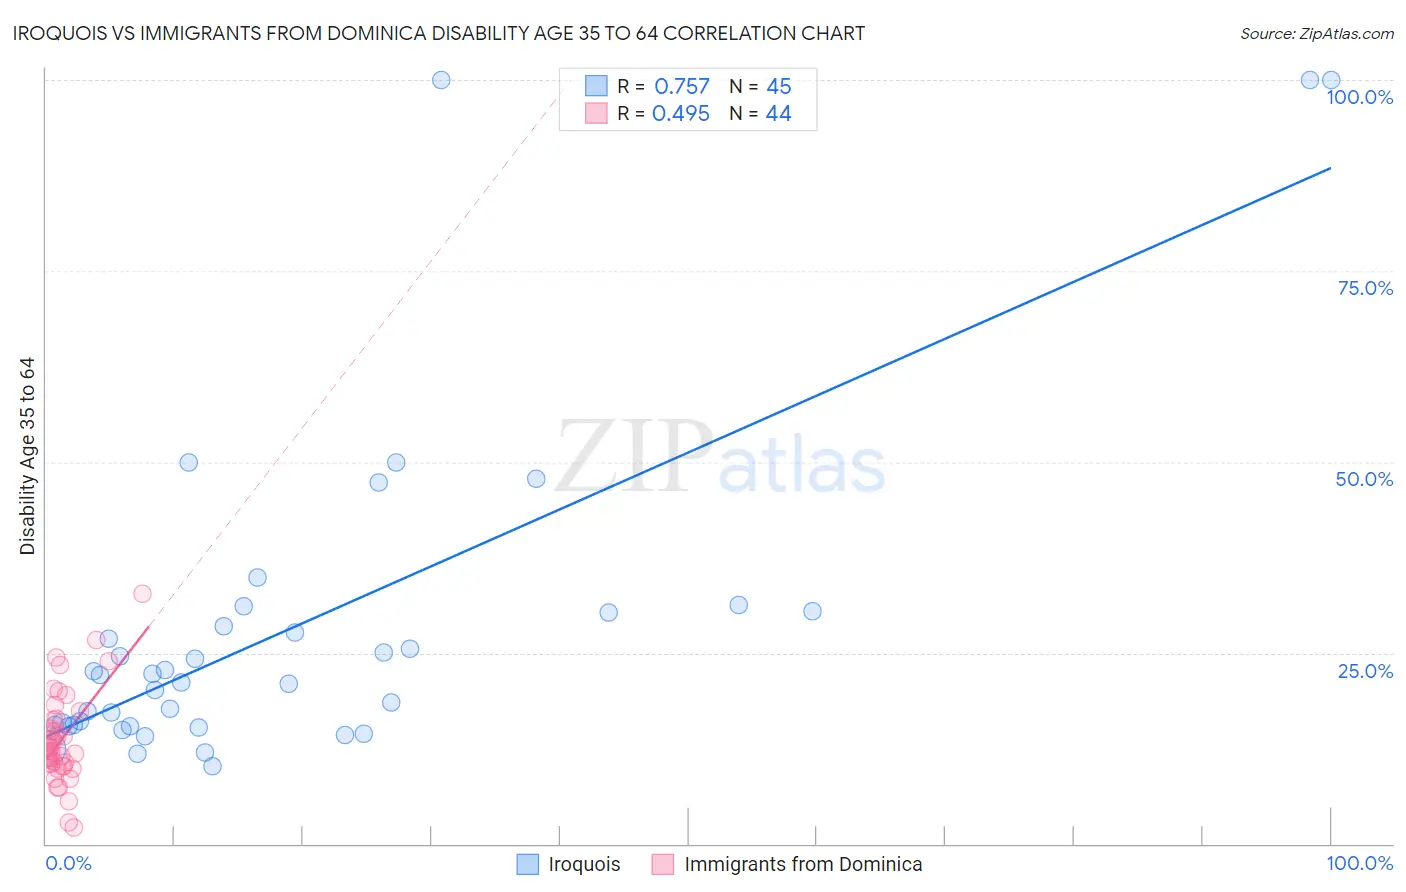
Iroquois vs Immigrants from Dominica Disability Age 35 to 64 Correlation Chart
The statistical analysis conducted on geographies consisting of 207,235,793 people shows a strong positive correlation between the proportion of Iroquois and percentage of population with a disability between the ages 34 and 64 in the United States with a correlation coefficient (R) of 0.757 and weighted average of 14.4%. Similarly, the statistical analysis conducted on geographies consisting of 83,788,429 people shows a moderate positive correlation between the proportion of Immigrants from Dominica and percentage of population with a disability between the ages 34 and 64 in the United States with a correlation coefficient (R) of 0.495 and weighted average of 12.7%, a difference of 13.3%.
Disability Age 35 to 64 Correlation Summary
| Measurement | Iroquois | Immigrants from Dominica |
| Minimum | 10.2% | 2.1% |
| Maximum | 100.0% | 32.8% |
| Range | 89.8% | 30.7% |
| Mean | 28.2% | 13.7% |
| Median | 22.1% | 12.4% |
| Interquartile 25% (IQ1) | 15.5% | 10.3% |
| Interquartile 75% (IQ3) | 30.4% | 16.3% |
| Interquartile Range (IQR) | 14.9% | 6.0% |
| Standard Deviation (Sample) | 21.9% | 6.1% |
| Standard Deviation (Population) | 21.6% | 6.0% |
Similar Demographics by Disability Age 35 to 64
Demographics Similar to Iroquois by Disability Age 35 to 64
In terms of disability age 35 to 64, the demographic groups most similar to Iroquois are Paiute (14.3%, a difference of 0.44%), Immigrants from the Azores (14.3%, a difference of 0.58%), Shoshone (14.5%, a difference of 0.76%), Alaska Native (14.5%, a difference of 0.77%), and Osage (14.5%, a difference of 0.97%).
| Demographics | Rating | Rank | Disability Age 35 to 64 |
| Immigrants | Yemen | 0.0 /100 | #306 | Tragic 14.0% |
| Blackfeet | 0.0 /100 | #307 | Tragic 14.1% |
| Inupiat | 0.0 /100 | #308 | Tragic 14.1% |
| Cree | 0.0 /100 | #309 | Tragic 14.1% |
| Cape Verdeans | 0.0 /100 | #310 | Tragic 14.1% |
| Immigrants | Azores | 0.0 /100 | #311 | Tragic 14.3% |
| Paiute | 0.0 /100 | #312 | Tragic 14.3% |
| Iroquois | 0.0 /100 | #313 | Tragic 14.4% |
| Shoshone | 0.0 /100 | #314 | Tragic 14.5% |
| Alaska Natives | 0.0 /100 | #315 | Tragic 14.5% |
| Osage | 0.0 /100 | #316 | Tragic 14.5% |
| Crow | 0.0 /100 | #317 | Tragic 14.6% |
| Ottawa | 0.0 /100 | #318 | Tragic 14.6% |
| Immigrants | Cabo Verde | 0.0 /100 | #319 | Tragic 14.7% |
| Blacks/African Americans | 0.0 /100 | #320 | Tragic 14.7% |
Demographics Similar to Immigrants from Dominica by Disability Age 35 to 64
In terms of disability age 35 to 64, the demographic groups most similar to Immigrants from Dominica are Spanish (12.7%, a difference of 0.10%), French (12.7%, a difference of 0.14%), Subsaharan African (12.6%, a difference of 0.18%), White/Caucasian (12.6%, a difference of 0.34%), and Marshallese (12.5%, a difference of 1.1%).
| Demographics | Rating | Rank | Disability Age 35 to 64 |
| Malaysians | 0.5 /100 | #261 | Tragic 12.5% |
| Senegalese | 0.5 /100 | #262 | Tragic 12.5% |
| Immigrants | Zaire | 0.4 /100 | #263 | Tragic 12.5% |
| Immigrants | Portugal | 0.4 /100 | #264 | Tragic 12.5% |
| Marshallese | 0.4 /100 | #265 | Tragic 12.5% |
| Whites/Caucasians | 0.3 /100 | #266 | Tragic 12.6% |
| Sub-Saharan Africans | 0.2 /100 | #267 | Tragic 12.6% |
| Immigrants | Dominica | 0.2 /100 | #268 | Tragic 12.7% |
| Spanish | 0.2 /100 | #269 | Tragic 12.7% |
| French | 0.2 /100 | #270 | Tragic 12.7% |
| Nepalese | 0.1 /100 | #271 | Tragic 12.8% |
| U.S. Virgin Islanders | 0.1 /100 | #272 | Tragic 12.8% |
| Pennsylvania Germans | 0.1 /100 | #273 | Tragic 12.8% |
| Celtics | 0.1 /100 | #274 | Tragic 12.9% |
| Dominicans | 0.1 /100 | #275 | Tragic 12.9% |