Houma vs Alaska Native Disability Age 35 to 64
COMPARE
Houma
Alaska Native
Disability Age 35 to 64
Disability Age 35 to 64 Comparison
Houma
Alaska Natives
18.7%
DISABILITY AGE 35 TO 64
0.0/ 100
METRIC RATING
347th/ 347
METRIC RANK
14.5%
DISABILITY AGE 35 TO 64
0.0/ 100
METRIC RATING
315th/ 347
METRIC RANK
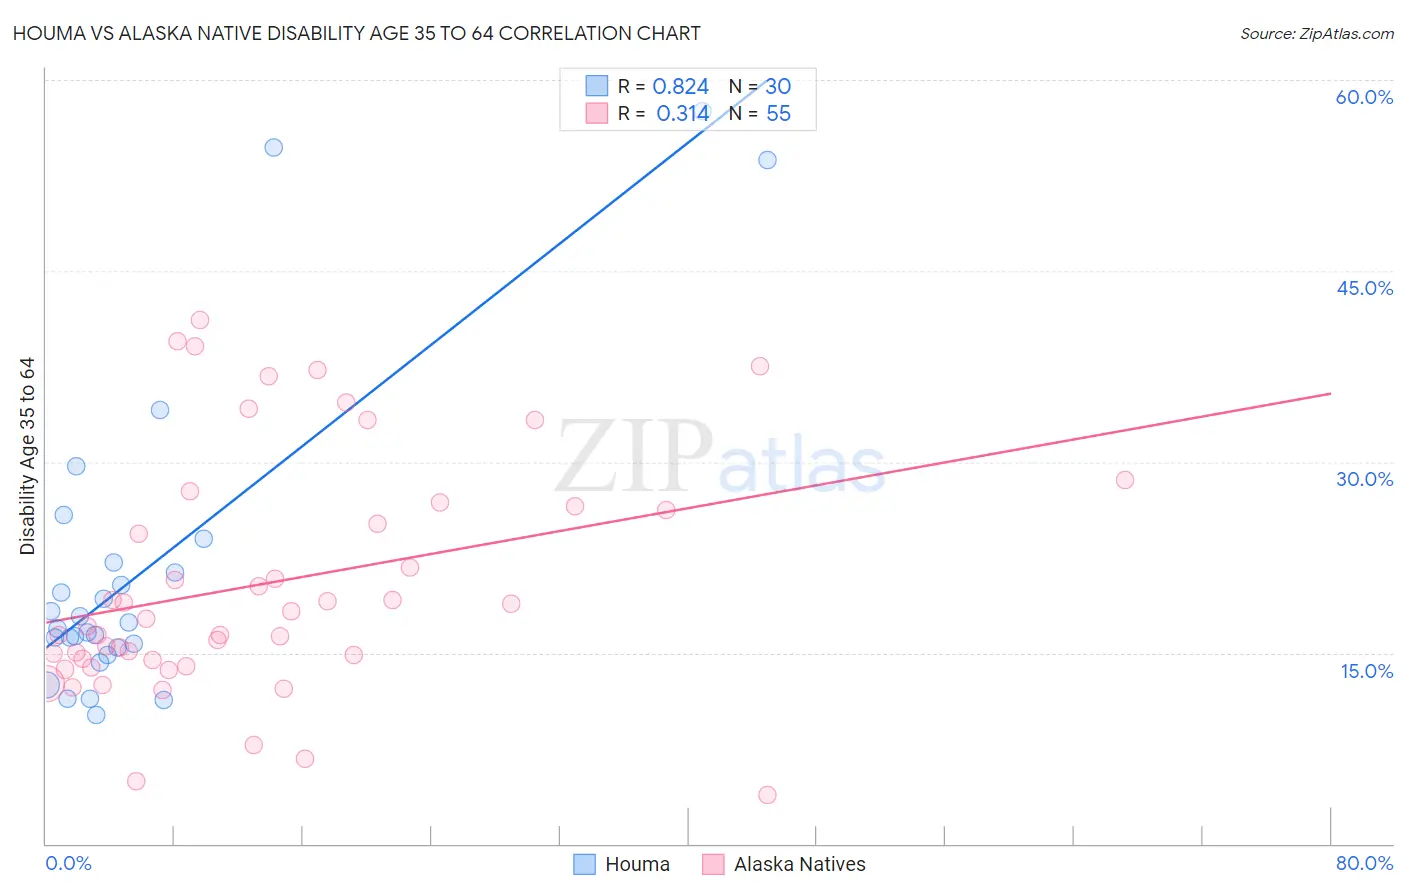
Houma vs Alaska Native Disability Age 35 to 64 Correlation Chart
The statistical analysis conducted on geographies consisting of 36,789,508 people shows a very strong positive correlation between the proportion of Houma and percentage of population with a disability between the ages 34 and 64 in the United States with a correlation coefficient (R) of 0.824 and weighted average of 18.7%. Similarly, the statistical analysis conducted on geographies consisting of 76,743,337 people shows a mild positive correlation between the proportion of Alaska Natives and percentage of population with a disability between the ages 34 and 64 in the United States with a correlation coefficient (R) of 0.314 and weighted average of 14.5%, a difference of 29.2%.
Disability Age 35 to 64 Correlation Summary
| Measurement | Houma | Alaska Native |
| Minimum | 10.2% | 3.8% |
| Maximum | 57.5% | 41.2% |
| Range | 47.3% | 37.3% |
| Mean | 21.7% | 20.5% |
| Median | 17.1% | 17.7% |
| Interquartile 25% (IQ1) | 15.4% | 14.5% |
| Interquartile 75% (IQ3) | 22.1% | 26.5% |
| Interquartile Range (IQR) | 6.7% | 12.1% |
| Standard Deviation (Sample) | 12.6% | 9.3% |
| Standard Deviation (Population) | 12.3% | 9.2% |
Similar Demographics by Disability Age 35 to 64
Demographics Similar to Houma by Disability Age 35 to 64
In terms of disability age 35 to 64, the demographic groups most similar to Houma are Lumbee (17.6%, a difference of 5.9%), Kiowa (17.4%, a difference of 7.7%), Yup'ik (16.9%, a difference of 10.3%), Creek (16.9%, a difference of 10.7%), and Tohono O'odham (16.7%, a difference of 11.6%).
| Demographics | Rating | Rank | Disability Age 35 to 64 |
| Yuman | 0.0 /100 | #333 | Tragic 15.8% |
| Colville | 0.0 /100 | #334 | Tragic 15.8% |
| Seminole | 0.0 /100 | #335 | Tragic 15.9% |
| Menominee | 0.0 /100 | #336 | Tragic 15.9% |
| Puerto Ricans | 0.0 /100 | #337 | Tragic 15.9% |
| Chickasaw | 0.0 /100 | #338 | Tragic 16.1% |
| Pima | 0.0 /100 | #339 | Tragic 16.1% |
| Choctaw | 0.0 /100 | #340 | Tragic 16.4% |
| Tsimshian | 0.0 /100 | #341 | Tragic 16.7% |
| Tohono O'odham | 0.0 /100 | #342 | Tragic 16.7% |
| Creek | 0.0 /100 | #343 | Tragic 16.9% |
| Yup'ik | 0.0 /100 | #344 | Tragic 16.9% |
| Kiowa | 0.0 /100 | #345 | Tragic 17.4% |
| Lumbee | 0.0 /100 | #346 | Tragic 17.6% |
| Houma | 0.0 /100 | #347 | Tragic 18.7% |
Demographics Similar to Alaska Natives by Disability Age 35 to 64
In terms of disability age 35 to 64, the demographic groups most similar to Alaska Natives are Shoshone (14.5%, a difference of 0.020%), Osage (14.5%, a difference of 0.19%), Iroquois (14.4%, a difference of 0.77%), Crow (14.6%, a difference of 1.1%), and Ottawa (14.6%, a difference of 1.1%).
| Demographics | Rating | Rank | Disability Age 35 to 64 |
| Inupiat | 0.0 /100 | #308 | Tragic 14.1% |
| Cree | 0.0 /100 | #309 | Tragic 14.1% |
| Cape Verdeans | 0.0 /100 | #310 | Tragic 14.1% |
| Immigrants | Azores | 0.0 /100 | #311 | Tragic 14.3% |
| Paiute | 0.0 /100 | #312 | Tragic 14.3% |
| Iroquois | 0.0 /100 | #313 | Tragic 14.4% |
| Shoshone | 0.0 /100 | #314 | Tragic 14.5% |
| Alaska Natives | 0.0 /100 | #315 | Tragic 14.5% |
| Osage | 0.0 /100 | #316 | Tragic 14.5% |
| Crow | 0.0 /100 | #317 | Tragic 14.6% |
| Ottawa | 0.0 /100 | #318 | Tragic 14.6% |
| Immigrants | Cabo Verde | 0.0 /100 | #319 | Tragic 14.7% |
| Blacks/African Americans | 0.0 /100 | #320 | Tragic 14.7% |
| Comanche | 0.0 /100 | #321 | Tragic 14.7% |
| Potawatomi | 0.0 /100 | #322 | Tragic 14.8% |