Fijian vs Immigrants from Dominica Disability Age 35 to 64
COMPARE
Fijian
Immigrants from Dominica
Disability Age 35 to 64
Disability Age 35 to 64 Comparison
Fijians
Immigrants from Dominica
13.2%
DISABILITY AGE 35 TO 64
0.0/ 100
METRIC RATING
288th/ 347
METRIC RANK
12.7%
DISABILITY AGE 35 TO 64
0.2/ 100
METRIC RATING
268th/ 347
METRIC RANK
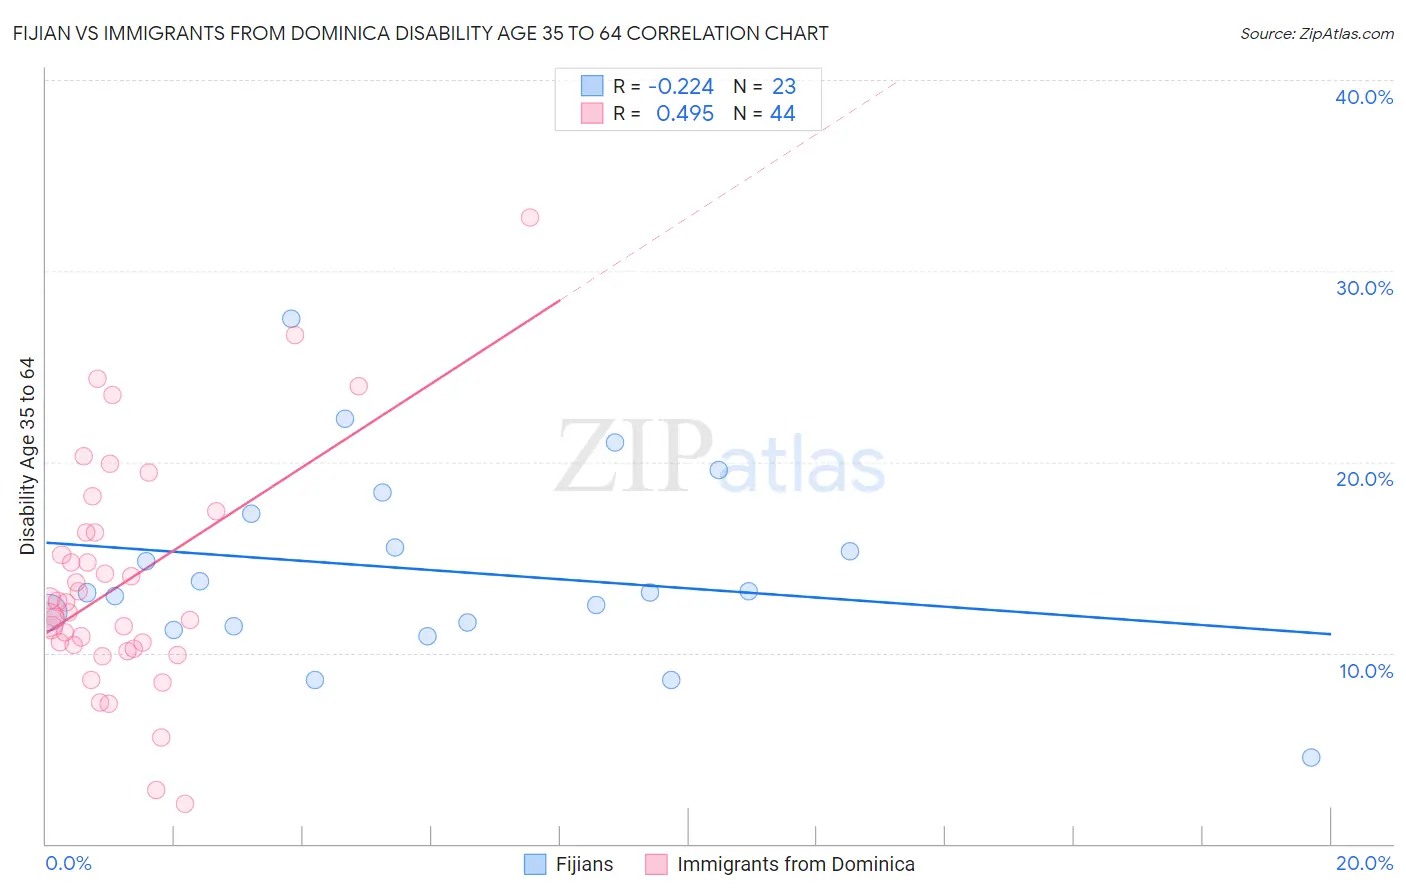
Fijian vs Immigrants from Dominica Disability Age 35 to 64 Correlation Chart
The statistical analysis conducted on geographies consisting of 55,946,690 people shows a weak negative correlation between the proportion of Fijians and percentage of population with a disability between the ages 34 and 64 in the United States with a correlation coefficient (R) of -0.224 and weighted average of 13.2%. Similarly, the statistical analysis conducted on geographies consisting of 83,788,429 people shows a moderate positive correlation between the proportion of Immigrants from Dominica and percentage of population with a disability between the ages 34 and 64 in the United States with a correlation coefficient (R) of 0.495 and weighted average of 12.7%, a difference of 4.4%.
Disability Age 35 to 64 Correlation Summary
| Measurement | Fijian | Immigrants from Dominica |
| Minimum | 4.5% | 2.1% |
| Maximum | 27.5% | 32.8% |
| Range | 22.9% | 30.7% |
| Mean | 14.3% | 13.7% |
| Median | 13.2% | 12.4% |
| Interquartile 25% (IQ1) | 11.4% | 10.3% |
| Interquartile 75% (IQ3) | 17.3% | 16.3% |
| Interquartile Range (IQR) | 5.9% | 6.0% |
| Standard Deviation (Sample) | 5.0% | 6.1% |
| Standard Deviation (Population) | 4.9% | 6.0% |
Demographics Similar to Fijians and Immigrants from Dominica by Disability Age 35 to 64
In terms of disability age 35 to 64, the demographic groups most similar to Fijians are Tlingit-Haida (13.2%, a difference of 0.35%), Hmong (13.1%, a difference of 0.62%), Immigrants from Somalia (13.1%, a difference of 0.94%), Nonimmigrants (13.0%, a difference of 1.4%), and Central American Indian (13.0%, a difference of 1.5%). Similarly, the demographic groups most similar to Immigrants from Dominica are Spanish (12.7%, a difference of 0.10%), French (12.7%, a difference of 0.14%), Nepalese (12.8%, a difference of 1.2%), U.S. Virgin Islander (12.8%, a difference of 1.4%), and Pennsylvania German (12.8%, a difference of 1.4%).
| Demographics | Rating | Rank | Disability Age 35 to 64 |
| Immigrants | Dominica | 0.2 /100 | #268 | Tragic 12.7% |
| Spanish | 0.2 /100 | #269 | Tragic 12.7% |
| French | 0.2 /100 | #270 | Tragic 12.7% |
| Nepalese | 0.1 /100 | #271 | Tragic 12.8% |
| U.S. Virgin Islanders | 0.1 /100 | #272 | Tragic 12.8% |
| Pennsylvania Germans | 0.1 /100 | #273 | Tragic 12.8% |
| Celtics | 0.1 /100 | #274 | Tragic 12.9% |
| Dominicans | 0.1 /100 | #275 | Tragic 12.9% |
| Somalis | 0.1 /100 | #276 | Tragic 12.9% |
| Immigrants | Dominican Republic | 0.1 /100 | #277 | Tragic 12.9% |
| French Canadians | 0.1 /100 | #278 | Tragic 12.9% |
| Immigrants | Micronesia | 0.1 /100 | #279 | Tragic 12.9% |
| Liberians | 0.1 /100 | #280 | Tragic 12.9% |
| Scotch-Irish | 0.1 /100 | #281 | Tragic 13.0% |
| Immigrants | Laos | 0.1 /100 | #282 | Tragic 13.0% |
| Central American Indians | 0.0 /100 | #283 | Tragic 13.0% |
| Immigrants | Nonimmigrants | 0.0 /100 | #284 | Tragic 13.0% |
| Immigrants | Somalia | 0.0 /100 | #285 | Tragic 13.1% |
| Hmong | 0.0 /100 | #286 | Tragic 13.1% |
| Tlingit-Haida | 0.0 /100 | #287 | Tragic 13.2% |
| Fijians | 0.0 /100 | #288 | Tragic 13.2% |