Houma vs Immigrants from Dominica Divorced or Separated
COMPARE
Houma
Immigrants from Dominica
Divorced or Separated
Divorced or Separated Comparison
Houma
Immigrants from Dominica
13.6%
DIVORCED OR SEPARATED
0.0/ 100
METRIC RATING
329th/ 347
METRIC RANK
12.6%
DIVORCED OR SEPARATED
0.5/ 100
METRIC RATING
261st/ 347
METRIC RANK
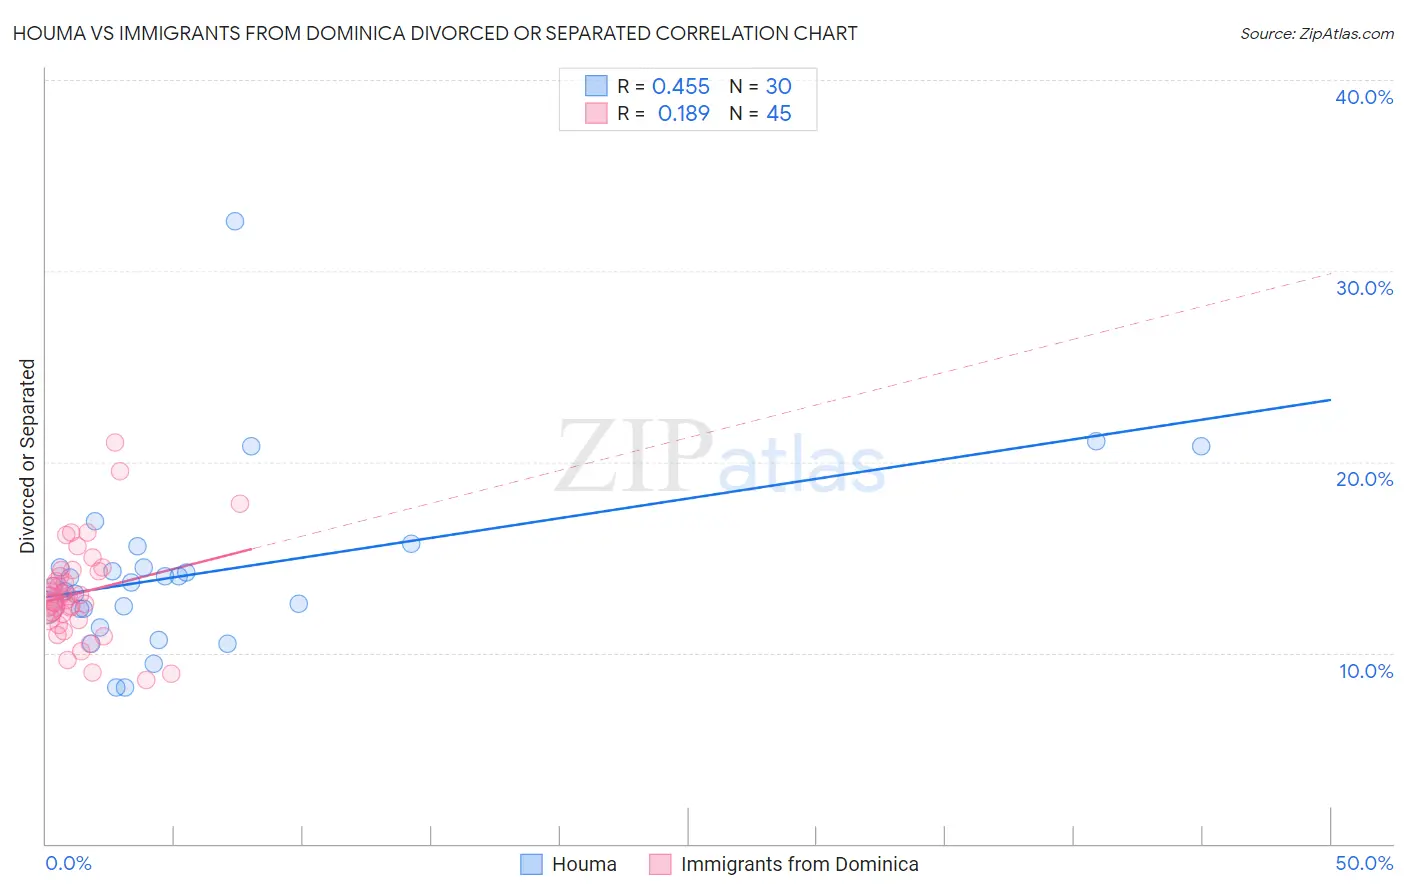
Houma vs Immigrants from Dominica Divorced or Separated Correlation Chart
The statistical analysis conducted on geographies consisting of 36,793,405 people shows a moderate positive correlation between the proportion of Houma and percentage of population currently divorced or separated in the United States with a correlation coefficient (R) of 0.455 and weighted average of 13.6%. Similarly, the statistical analysis conducted on geographies consisting of 83,792,024 people shows a poor positive correlation between the proportion of Immigrants from Dominica and percentage of population currently divorced or separated in the United States with a correlation coefficient (R) of 0.189 and weighted average of 12.6%, a difference of 7.9%.
Divorced or Separated Correlation Summary
| Measurement | Houma | Immigrants from Dominica |
| Minimum | 8.2% | 8.6% |
| Maximum | 32.6% | 21.0% |
| Range | 24.4% | 12.4% |
| Mean | 14.2% | 13.1% |
| Median | 13.6% | 12.7% |
| Interquartile 25% (IQ1) | 12.3% | 11.8% |
| Interquartile 75% (IQ3) | 14.5% | 14.3% |
| Interquartile Range (IQR) | 2.2% | 2.5% |
| Standard Deviation (Sample) | 4.7% | 2.5% |
| Standard Deviation (Population) | 4.6% | 2.5% |
Similar Demographics by Divorced or Separated
Demographics Similar to Houma by Divorced or Separated
In terms of divorced or separated, the demographic groups most similar to Houma are Paiute (13.6%, a difference of 0.11%), Immigrants from Caribbean (13.6%, a difference of 0.15%), Black/African American (13.6%, a difference of 0.24%), Comanche (13.5%, a difference of 0.53%), and Cherokee (13.7%, a difference of 1.0%).
| Demographics | Rating | Rank | Divorced or Separated |
| Immigrants | Haiti | 0.0 /100 | #322 | Tragic 13.4% |
| U.S. Virgin Islanders | 0.0 /100 | #323 | Tragic 13.4% |
| Osage | 0.0 /100 | #324 | Tragic 13.4% |
| Potawatomi | 0.0 /100 | #325 | Tragic 13.5% |
| Immigrants | Congo | 0.0 /100 | #326 | Tragic 13.5% |
| Comanche | 0.0 /100 | #327 | Tragic 13.5% |
| Immigrants | Caribbean | 0.0 /100 | #328 | Tragic 13.6% |
| Houma | 0.0 /100 | #329 | Tragic 13.6% |
| Paiute | 0.0 /100 | #330 | Tragic 13.6% |
| Blacks/African Americans | 0.0 /100 | #331 | Tragic 13.6% |
| Cherokee | 0.0 /100 | #332 | Tragic 13.7% |
| Puerto Ricans | 0.0 /100 | #333 | Tragic 13.9% |
| Immigrants | Bahamas | 0.0 /100 | #334 | Tragic 13.9% |
| Dutch West Indians | 0.0 /100 | #335 | Tragic 14.0% |
| Shoshone | 0.0 /100 | #336 | Tragic 14.0% |
Demographics Similar to Immigrants from Dominica by Divorced or Separated
In terms of divorced or separated, the demographic groups most similar to Immigrants from Dominica are Yuman (12.6%, a difference of 0.030%), Immigrants from Uruguay (12.6%, a difference of 0.030%), Immigrants from Somalia (12.6%, a difference of 0.050%), Indonesian (12.6%, a difference of 0.050%), and Basque (12.6%, a difference of 0.060%).
| Demographics | Rating | Rank | Divorced or Separated |
| Senegalese | 0.8 /100 | #254 | Tragic 12.6% |
| Welsh | 0.7 /100 | #255 | Tragic 12.6% |
| Immigrants | Colombia | 0.6 /100 | #256 | Tragic 12.6% |
| Immigrants | Somalia | 0.6 /100 | #257 | Tragic 12.6% |
| Indonesians | 0.6 /100 | #258 | Tragic 12.6% |
| Yuman | 0.6 /100 | #259 | Tragic 12.6% |
| Immigrants | Uruguay | 0.6 /100 | #260 | Tragic 12.6% |
| Immigrants | Dominica | 0.5 /100 | #261 | Tragic 12.6% |
| Basques | 0.5 /100 | #262 | Tragic 12.6% |
| Immigrants | Panama | 0.5 /100 | #263 | Tragic 12.6% |
| English | 0.5 /100 | #264 | Tragic 12.6% |
| Immigrants | Senegal | 0.5 /100 | #265 | Tragic 12.6% |
| Whites/Caucasians | 0.5 /100 | #266 | Tragic 12.6% |
| Scottish | 0.4 /100 | #267 | Tragic 12.6% |
| Fijians | 0.4 /100 | #268 | Tragic 12.6% |