Liberian vs Immigrants from Dominica Disability Age 35 to 64
COMPARE
Liberian
Immigrants from Dominica
Disability Age 35 to 64
Disability Age 35 to 64 Comparison
Liberians
Immigrants from Dominica
12.9%
DISABILITY AGE 35 TO 64
0.1/ 100
METRIC RATING
280th/ 347
METRIC RANK
12.7%
DISABILITY AGE 35 TO 64
0.2/ 100
METRIC RATING
268th/ 347
METRIC RANK
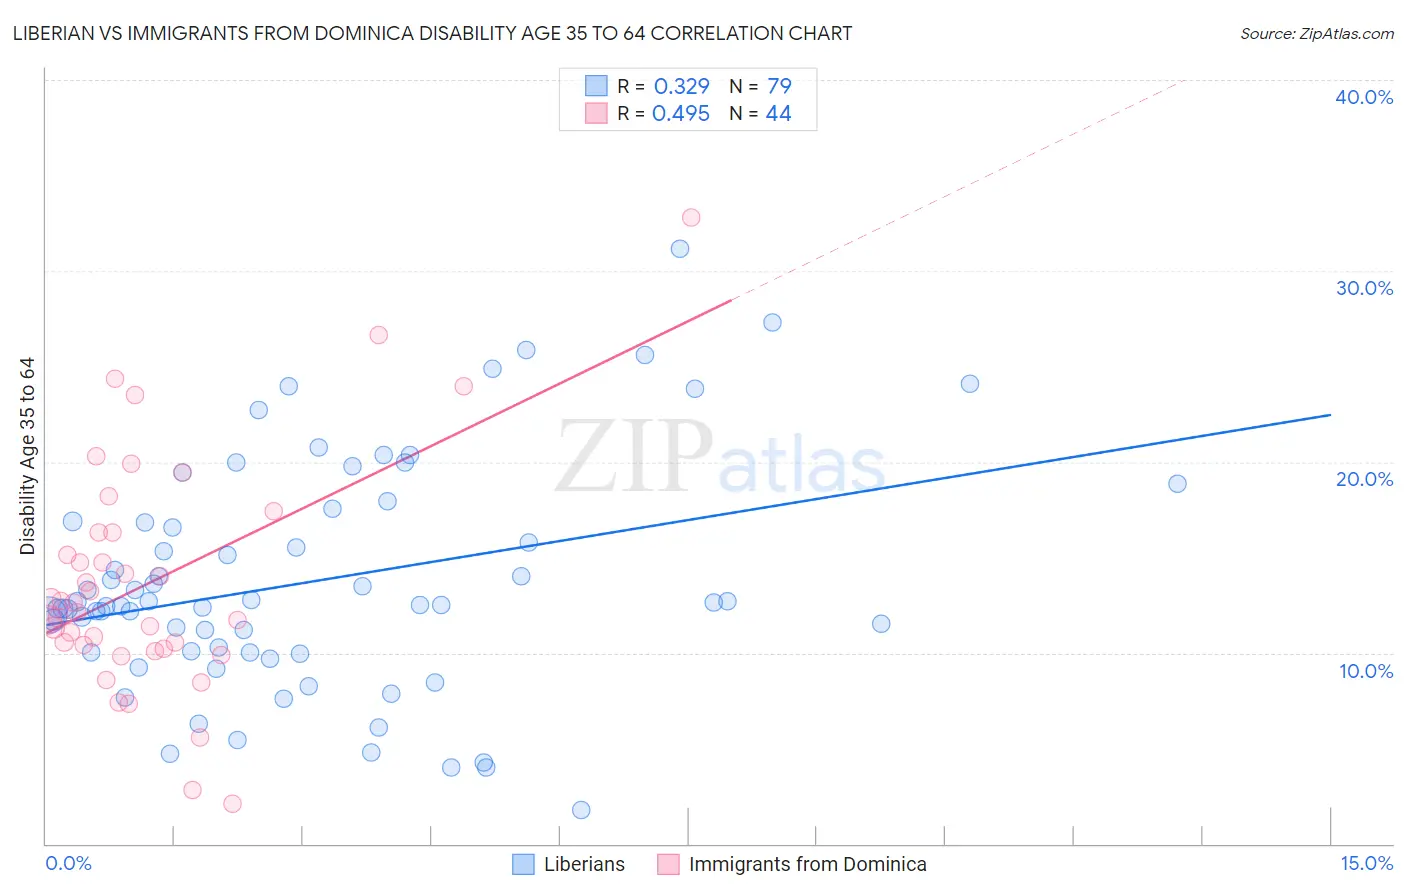
Liberian vs Immigrants from Dominica Disability Age 35 to 64 Correlation Chart
The statistical analysis conducted on geographies consisting of 118,034,378 people shows a mild positive correlation between the proportion of Liberians and percentage of population with a disability between the ages 34 and 64 in the United States with a correlation coefficient (R) of 0.329 and weighted average of 12.9%. Similarly, the statistical analysis conducted on geographies consisting of 83,788,429 people shows a moderate positive correlation between the proportion of Immigrants from Dominica and percentage of population with a disability between the ages 34 and 64 in the United States with a correlation coefficient (R) of 0.495 and weighted average of 12.7%, a difference of 2.1%.
Disability Age 35 to 64 Correlation Summary
| Measurement | Liberian | Immigrants from Dominica |
| Minimum | 1.8% | 2.1% |
| Maximum | 31.1% | 32.8% |
| Range | 29.3% | 30.7% |
| Mean | 13.7% | 13.7% |
| Median | 12.5% | 12.4% |
| Interquartile 25% (IQ1) | 10.0% | 10.3% |
| Interquartile 75% (IQ3) | 16.9% | 16.3% |
| Interquartile Range (IQR) | 6.8% | 6.0% |
| Standard Deviation (Sample) | 6.0% | 6.1% |
| Standard Deviation (Population) | 5.9% | 6.0% |
Demographics Similar to Liberians and Immigrants from Dominica by Disability Age 35 to 64
In terms of disability age 35 to 64, the demographic groups most similar to Liberians are Immigrants from Micronesia (12.9%, a difference of 0.17%), French Canadian (12.9%, a difference of 0.19%), Scotch-Irish (13.0%, a difference of 0.20%), Immigrants from Dominican Republic (12.9%, a difference of 0.22%), and Immigrants from Laos (13.0%, a difference of 0.29%). Similarly, the demographic groups most similar to Immigrants from Dominica are Spanish (12.7%, a difference of 0.10%), French (12.7%, a difference of 0.14%), Subsaharan African (12.6%, a difference of 0.18%), White/Caucasian (12.6%, a difference of 0.34%), and Marshallese (12.5%, a difference of 1.1%).
| Demographics | Rating | Rank | Disability Age 35 to 64 |
| Immigrants | Portugal | 0.4 /100 | #264 | Tragic 12.5% |
| Marshallese | 0.4 /100 | #265 | Tragic 12.5% |
| Whites/Caucasians | 0.3 /100 | #266 | Tragic 12.6% |
| Sub-Saharan Africans | 0.2 /100 | #267 | Tragic 12.6% |
| Immigrants | Dominica | 0.2 /100 | #268 | Tragic 12.7% |
| Spanish | 0.2 /100 | #269 | Tragic 12.7% |
| French | 0.2 /100 | #270 | Tragic 12.7% |
| Nepalese | 0.1 /100 | #271 | Tragic 12.8% |
| U.S. Virgin Islanders | 0.1 /100 | #272 | Tragic 12.8% |
| Pennsylvania Germans | 0.1 /100 | #273 | Tragic 12.8% |
| Celtics | 0.1 /100 | #274 | Tragic 12.9% |
| Dominicans | 0.1 /100 | #275 | Tragic 12.9% |
| Somalis | 0.1 /100 | #276 | Tragic 12.9% |
| Immigrants | Dominican Republic | 0.1 /100 | #277 | Tragic 12.9% |
| French Canadians | 0.1 /100 | #278 | Tragic 12.9% |
| Immigrants | Micronesia | 0.1 /100 | #279 | Tragic 12.9% |
| Liberians | 0.1 /100 | #280 | Tragic 12.9% |
| Scotch-Irish | 0.1 /100 | #281 | Tragic 13.0% |
| Immigrants | Laos | 0.1 /100 | #282 | Tragic 13.0% |
| Central American Indians | 0.0 /100 | #283 | Tragic 13.0% |
| Immigrants | Nonimmigrants | 0.0 /100 | #284 | Tragic 13.0% |