Immigrants from Laos vs German Russian Vision Disability
COMPARE
Immigrants from Laos
German Russian
Vision Disability
Vision Disability Comparison
Immigrants from Laos
German Russians
2.4%
VISION DISABILITY
0.4/ 100
METRIC RATING
251st/ 347
METRIC RANK
2.3%
VISION DISABILITY
1.8/ 100
METRIC RATING
232nd/ 347
METRIC RANK
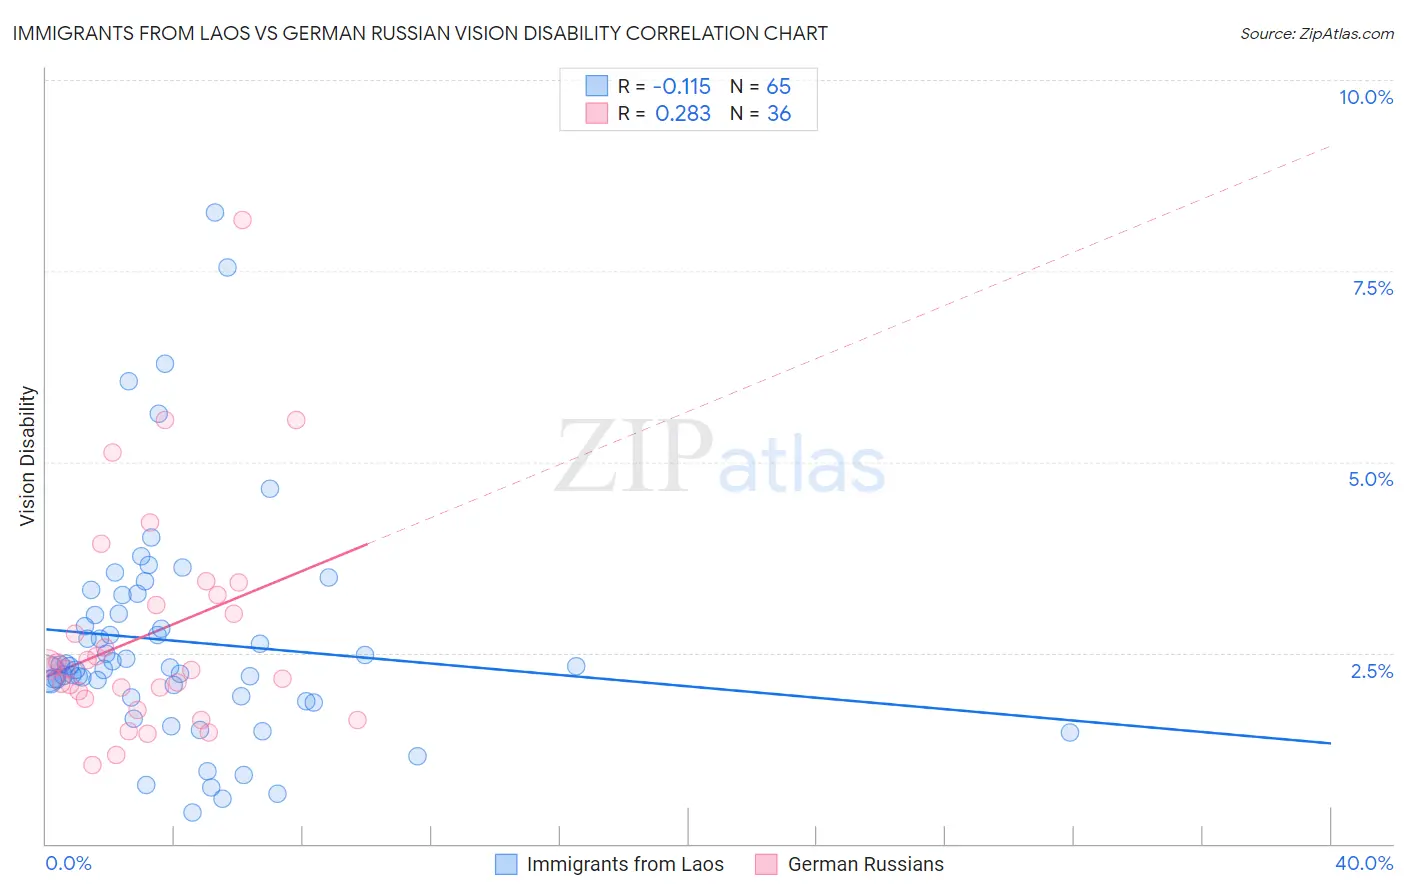
Immigrants from Laos vs German Russian Vision Disability Correlation Chart
The statistical analysis conducted on geographies consisting of 201,435,761 people shows a poor negative correlation between the proportion of Immigrants from Laos and percentage of population with vision disability in the United States with a correlation coefficient (R) of -0.115 and weighted average of 2.4%. Similarly, the statistical analysis conducted on geographies consisting of 96,448,558 people shows a weak positive correlation between the proportion of German Russians and percentage of population with vision disability in the United States with a correlation coefficient (R) of 0.283 and weighted average of 2.3%, a difference of 2.1%.
Vision Disability Correlation Summary
| Measurement | Immigrants from Laos | German Russian |
| Minimum | 0.41% | 1.0% |
| Maximum | 8.3% | 8.2% |
| Range | 7.8% | 7.1% |
| Mean | 2.7% | 2.7% |
| Median | 2.3% | 2.3% |
| Interquartile 25% (IQ1) | 1.9% | 1.9% |
| Interquartile 75% (IQ3) | 3.1% | 3.2% |
| Interquartile Range (IQR) | 1.2% | 1.2% |
| Standard Deviation (Sample) | 1.5% | 1.5% |
| Standard Deviation (Population) | 1.5% | 1.4% |
Demographics Similar to Immigrants from Laos and German Russians by Vision Disability
In terms of vision disability, the demographic groups most similar to Immigrants from Laos are Bangladeshi (2.3%, a difference of 0.11%), Liberian (2.3%, a difference of 0.19%), Subsaharan African (2.3%, a difference of 0.21%), Guatemalan (2.3%, a difference of 0.23%), and French (2.3%, a difference of 0.27%). Similarly, the demographic groups most similar to German Russians are Central American (2.3%, a difference of 0.020%), Immigrants from Ecuador (2.3%, a difference of 0.19%), Scottish (2.3%, a difference of 0.20%), Marshallese (2.3%, a difference of 0.27%), and Immigrants from Congo (2.3%, a difference of 0.36%).
| Demographics | Rating | Rank | Vision Disability |
| Immigrants | Ecuador | 2.0 /100 | #231 | Tragic 2.3% |
| German Russians | 1.8 /100 | #232 | Tragic 2.3% |
| Central Americans | 1.8 /100 | #233 | Tragic 2.3% |
| Scottish | 1.6 /100 | #234 | Tragic 2.3% |
| Marshallese | 1.5 /100 | #235 | Tragic 2.3% |
| Immigrants | Congo | 1.4 /100 | #236 | Tragic 2.3% |
| Immigrants | Portugal | 1.4 /100 | #237 | Tragic 2.3% |
| Immigrants | Cambodia | 1.1 /100 | #238 | Tragic 2.3% |
| English | 1.1 /100 | #239 | Tragic 2.3% |
| Panamanians | 0.9 /100 | #240 | Tragic 2.3% |
| Malaysians | 0.9 /100 | #241 | Tragic 2.3% |
| Immigrants | Panama | 0.8 /100 | #242 | Tragic 2.3% |
| Immigrants | Nicaragua | 0.6 /100 | #243 | Tragic 2.3% |
| Immigrants | West Indies | 0.6 /100 | #244 | Tragic 2.3% |
| Alsatians | 0.6 /100 | #245 | Tragic 2.3% |
| French | 0.5 /100 | #246 | Tragic 2.3% |
| Guatemalans | 0.5 /100 | #247 | Tragic 2.3% |
| Sub-Saharan Africans | 0.5 /100 | #248 | Tragic 2.3% |
| Liberians | 0.5 /100 | #249 | Tragic 2.3% |
| Bangladeshis | 0.5 /100 | #250 | Tragic 2.3% |
| Immigrants | Laos | 0.4 /100 | #251 | Tragic 2.4% |