Houma vs German Russian Family Households with Children
COMPARE
Houma
German Russian
Family Households with Children
Family Households with Children Comparison
Houma
German Russians
28.5%
FAMILY HOUSEHOLDS WITH CHILDREN
99.9/ 100
METRIC RATING
68th/ 347
METRIC RANK
26.8%
FAMILY HOUSEHOLDS WITH CHILDREN
1.5/ 100
METRIC RATING
255th/ 347
METRIC RANK
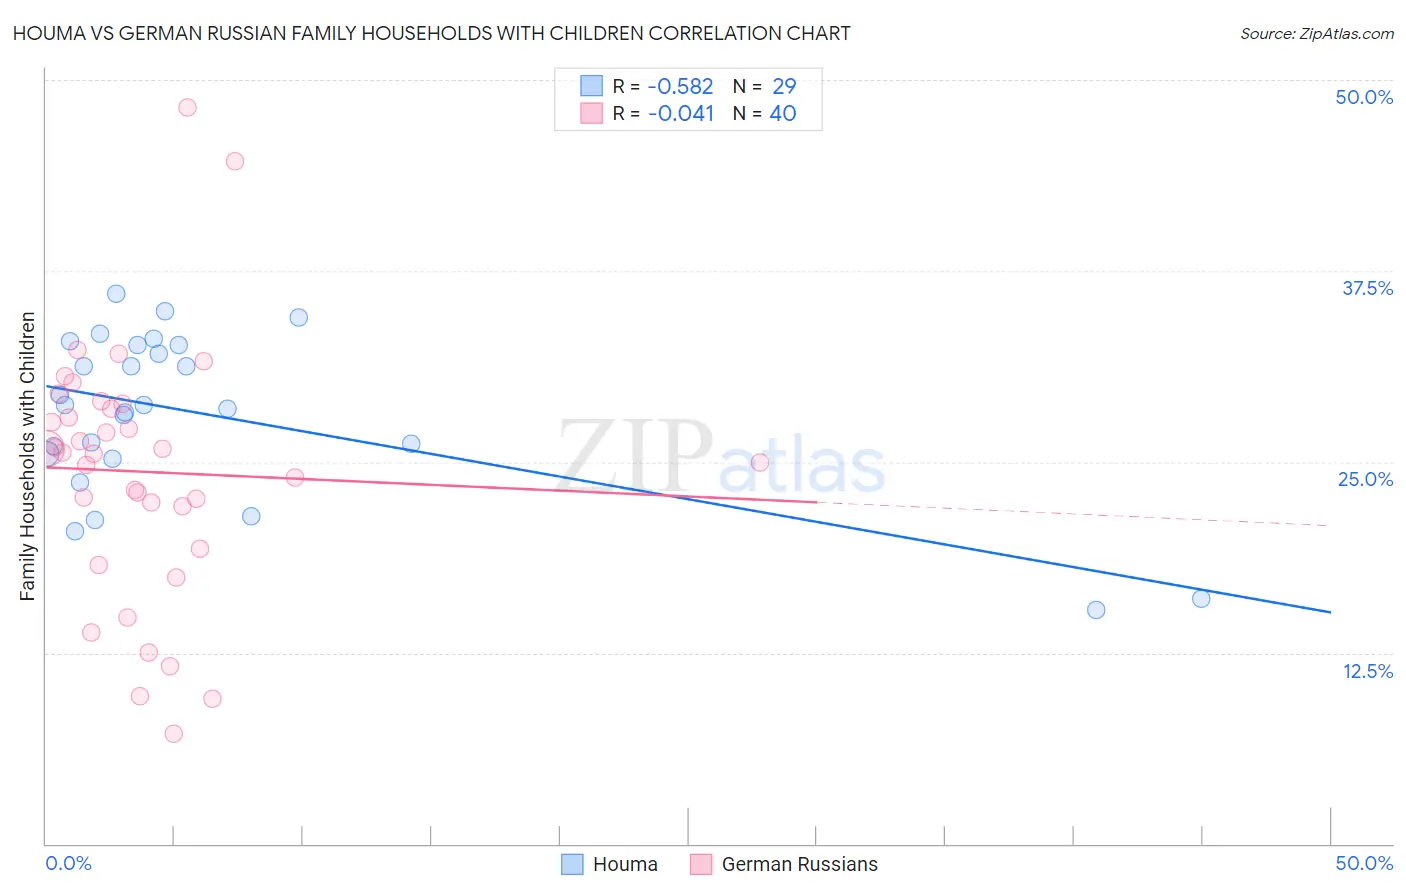
Houma vs German Russian Family Households with Children Correlation Chart
The statistical analysis conducted on geographies consisting of 36,792,477 people shows a substantial negative correlation between the proportion of Houma and percentage of family households with children in the United States with a correlation coefficient (R) of -0.582 and weighted average of 28.5%. Similarly, the statistical analysis conducted on geographies consisting of 96,442,482 people shows no correlation between the proportion of German Russians and percentage of family households with children in the United States with a correlation coefficient (R) of -0.041 and weighted average of 26.8%, a difference of 6.4%.
Family Households with Children Correlation Summary
| Measurement | Houma | German Russian |
| Minimum | 15.3% | 7.2% |
| Maximum | 36.0% | 48.2% |
| Range | 20.7% | 41.0% |
| Mean | 28.1% | 24.4% |
| Median | 28.7% | 25.6% |
| Interquartile 25% (IQ1) | 25.4% | 20.7% |
| Interquartile 75% (IQ3) | 32.6% | 28.7% |
| Interquartile Range (IQR) | 7.3% | 7.9% |
| Standard Deviation (Sample) | 5.4% | 8.4% |
| Standard Deviation (Population) | 5.3% | 8.3% |
Similar Demographics by Family Households with Children
Demographics Similar to Houma by Family Households with Children
In terms of family households with children, the demographic groups most similar to Houma are Honduran (28.5%, a difference of 0.020%), Immigrants from Egypt (28.5%, a difference of 0.020%), Ghanaian (28.5%, a difference of 0.020%), Immigrants from Korea (28.5%, a difference of 0.020%), and Immigrants from Honduras (28.5%, a difference of 0.070%).
| Demographics | Rating | Rank | Family Households with Children |
| Immigrants | Ghana | 99.9 /100 | #61 | Exceptional 28.6% |
| Egyptians | 99.9 /100 | #62 | Exceptional 28.6% |
| Immigrants | Lebanon | 99.9 /100 | #63 | Exceptional 28.6% |
| Filipinos | 99.9 /100 | #64 | Exceptional 28.6% |
| Hondurans | 99.9 /100 | #65 | Exceptional 28.5% |
| Immigrants | Egypt | 99.9 /100 | #66 | Exceptional 28.5% |
| Ghanaians | 99.9 /100 | #67 | Exceptional 28.5% |
| Houma | 99.9 /100 | #68 | Exceptional 28.5% |
| Immigrants | Korea | 99.9 /100 | #69 | Exceptional 28.5% |
| Immigrants | Honduras | 99.9 /100 | #70 | Exceptional 28.5% |
| Burmese | 99.9 /100 | #71 | Exceptional 28.5% |
| Immigrants | Indonesia | 99.9 /100 | #72 | Exceptional 28.5% |
| Iraqis | 99.9 /100 | #73 | Exceptional 28.5% |
| Laotians | 99.9 /100 | #74 | Exceptional 28.5% |
| Immigrants | Jordan | 99.9 /100 | #75 | Exceptional 28.4% |
Demographics Similar to German Russians by Family Households with Children
In terms of family households with children, the demographic groups most similar to German Russians are Immigrants from Scotland (26.8%, a difference of 0.0%), Scotch-Irish (26.8%, a difference of 0.010%), Italian (26.8%, a difference of 0.030%), Slavic (26.8%, a difference of 0.060%), and Immigrants from Cuba (26.8%, a difference of 0.070%).
| Demographics | Rating | Rank | Family Households with Children |
| Immigrants | Kazakhstan | 2.2 /100 | #248 | Tragic 26.9% |
| Immigrants | Eastern Europe | 2.1 /100 | #249 | Tragic 26.9% |
| Belgians | 2.1 /100 | #250 | Tragic 26.9% |
| Immigrants | Bosnia and Herzegovina | 1.9 /100 | #251 | Tragic 26.8% |
| Irish | 1.8 /100 | #252 | Tragic 26.8% |
| Italians | 1.5 /100 | #253 | Tragic 26.8% |
| Immigrants | Scotland | 1.5 /100 | #254 | Tragic 26.8% |
| German Russians | 1.5 /100 | #255 | Tragic 26.8% |
| Scotch-Irish | 1.4 /100 | #256 | Tragic 26.8% |
| Slavs | 1.3 /100 | #257 | Tragic 26.8% |
| Immigrants | Cuba | 1.3 /100 | #258 | Tragic 26.8% |
| Immigrants | Lithuania | 1.2 /100 | #259 | Tragic 26.8% |
| Immigrants | Jamaica | 1.2 /100 | #260 | Tragic 26.8% |
| Immigrants | Belarus | 1.1 /100 | #261 | Tragic 26.8% |
| Immigrants | Russia | 1.0 /100 | #262 | Tragic 26.8% |