Hmong vs Immigrants from Central America Hearing Disability
COMPARE
Hmong
Immigrants from Central America
Hearing Disability
Hearing Disability Comparison
Hmong
Immigrants from Central America
3.4%
HEARING DISABILITY
0.2/ 100
METRIC RATING
256th/ 347
METRIC RANK
3.0%
HEARING DISABILITY
64.9/ 100
METRIC RATING
163rd/ 347
METRIC RANK
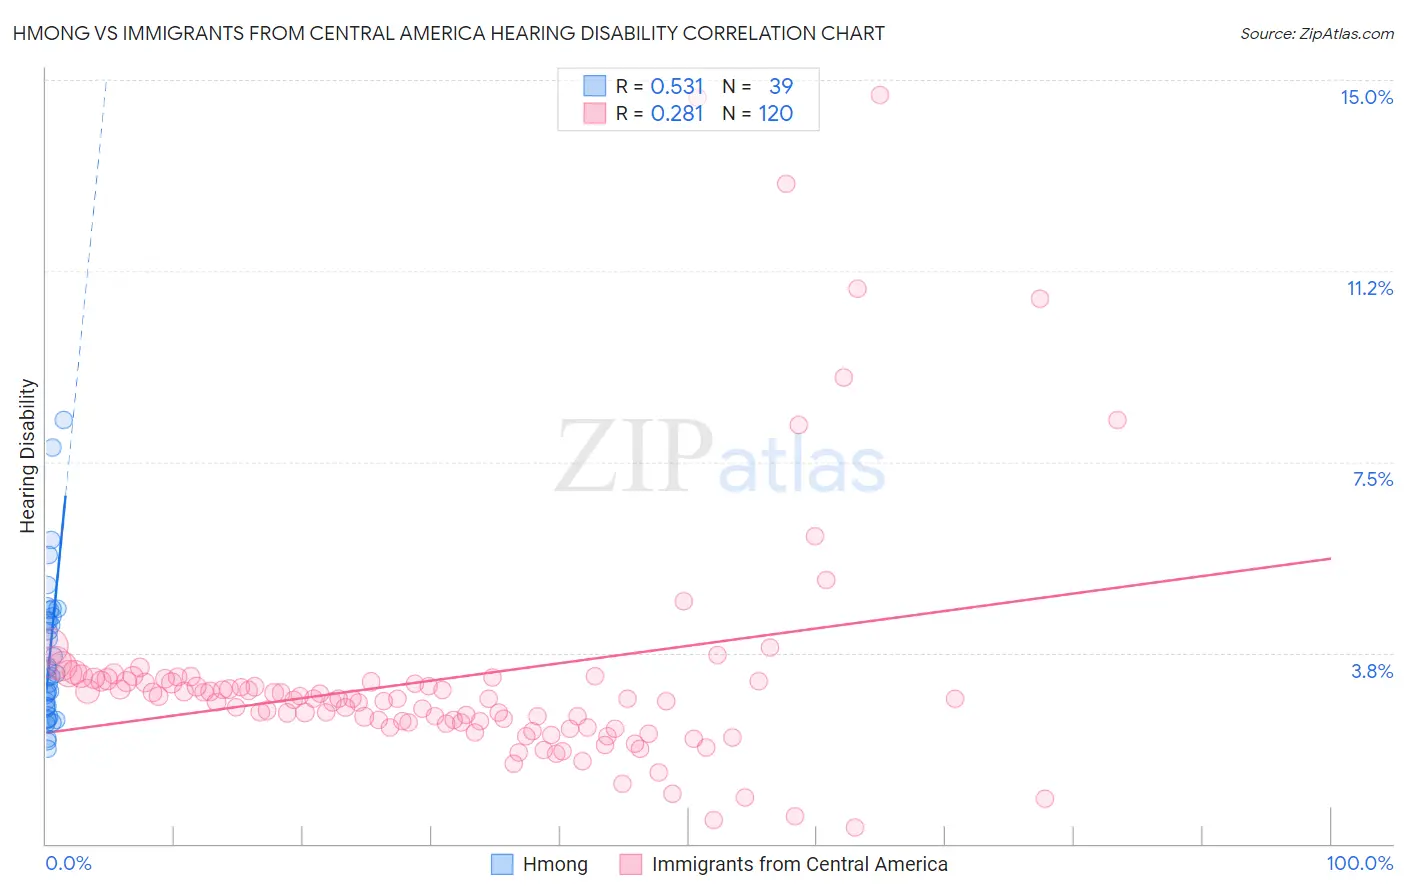
Hmong vs Immigrants from Central America Hearing Disability Correlation Chart
The statistical analysis conducted on geographies consisting of 24,680,511 people shows a substantial positive correlation between the proportion of Hmong and percentage of population with hearing disability in the United States with a correlation coefficient (R) of 0.531 and weighted average of 3.4%. Similarly, the statistical analysis conducted on geographies consisting of 535,995,824 people shows a weak positive correlation between the proportion of Immigrants from Central America and percentage of population with hearing disability in the United States with a correlation coefficient (R) of 0.281 and weighted average of 3.0%, a difference of 16.2%.
Hearing Disability Correlation Summary
| Measurement | Hmong | Immigrants from Central America |
| Minimum | 1.9% | 0.32% |
| Maximum | 8.3% | 14.7% |
| Range | 6.5% | 14.4% |
| Mean | 3.7% | 3.2% |
| Median | 3.3% | 2.8% |
| Interquartile 25% (IQ1) | 2.6% | 2.3% |
| Interquartile 75% (IQ3) | 4.5% | 3.2% |
| Interquartile Range (IQR) | 1.8% | 0.87% |
| Standard Deviation (Sample) | 1.5% | 2.4% |
| Standard Deviation (Population) | 1.4% | 2.4% |
Similar Demographics by Hearing Disability
Demographics Similar to Hmong by Hearing Disability
In terms of hearing disability, the demographic groups most similar to Hmong are Polish (3.4%, a difference of 0.040%), Slavic (3.4%, a difference of 0.27%), Yaqui (3.4%, a difference of 0.45%), Northern European (3.4%, a difference of 0.52%), and Carpatho Rusyn (3.4%, a difference of 0.70%).
| Demographics | Rating | Rank | Hearing Disability |
| Italians | 0.4 /100 | #249 | Tragic 3.4% |
| Yuman | 0.4 /100 | #250 | Tragic 3.4% |
| Hungarians | 0.4 /100 | #251 | Tragic 3.4% |
| Croatians | 0.4 /100 | #252 | Tragic 3.4% |
| Carpatho Rusyns | 0.3 /100 | #253 | Tragic 3.4% |
| Slavs | 0.2 /100 | #254 | Tragic 3.4% |
| Poles | 0.2 /100 | #255 | Tragic 3.4% |
| Hmong | 0.2 /100 | #256 | Tragic 3.4% |
| Yaqui | 0.2 /100 | #257 | Tragic 3.4% |
| Northern Europeans | 0.2 /100 | #258 | Tragic 3.4% |
| Slovenes | 0.1 /100 | #259 | Tragic 3.5% |
| Portuguese | 0.1 /100 | #260 | Tragic 3.5% |
| Hawaiians | 0.1 /100 | #261 | Tragic 3.5% |
| Immigrants | North America | 0.1 /100 | #262 | Tragic 3.5% |
| Immigrants | Canada | 0.1 /100 | #263 | Tragic 3.5% |
Demographics Similar to Immigrants from Central America by Hearing Disability
In terms of hearing disability, the demographic groups most similar to Immigrants from Central America are Immigrants from Cambodia (3.0%, a difference of 0.020%), Immigrants from Zimbabwe (3.0%, a difference of 0.080%), Immigrants from Japan (2.9%, a difference of 0.15%), Albanian (2.9%, a difference of 0.17%), and Immigrants from South Eastern Asia (3.0%, a difference of 0.21%).
| Demographics | Rating | Rank | Hearing Disability |
| Immigrants | Poland | 70.2 /100 | #156 | Good 2.9% |
| Immigrants | Kazakhstan | 69.6 /100 | #157 | Good 2.9% |
| Immigrants | Burma/Myanmar | 69.5 /100 | #158 | Good 2.9% |
| Immigrants | Australia | 67.4 /100 | #159 | Good 2.9% |
| Immigrants | Fiji | 67.1 /100 | #160 | Good 2.9% |
| Albanians | 66.6 /100 | #161 | Good 2.9% |
| Immigrants | Japan | 66.3 /100 | #162 | Good 2.9% |
| Immigrants | Central America | 64.9 /100 | #163 | Good 3.0% |
| Immigrants | Cambodia | 64.8 /100 | #164 | Good 3.0% |
| Immigrants | Zimbabwe | 64.2 /100 | #165 | Good 3.0% |
| Immigrants | South Eastern Asia | 62.9 /100 | #166 | Good 3.0% |
| Immigrants | Eastern Europe | 58.1 /100 | #167 | Average 3.0% |
| Immigrants | Greece | 57.9 /100 | #168 | Average 3.0% |
| Arabs | 57.6 /100 | #169 | Average 3.0% |
| Immigrants | Cabo Verde | 56.9 /100 | #170 | Average 3.0% |