Hmong vs Immigrants from Uzbekistan Hearing Disability
COMPARE
Hmong
Immigrants from Uzbekistan
Hearing Disability
Hearing Disability Comparison
Hmong
Immigrants from Uzbekistan
3.4%
HEARING DISABILITY
0.2/ 100
METRIC RATING
256th/ 347
METRIC RANK
2.7%
HEARING DISABILITY
98.4/ 100
METRIC RATING
61st/ 347
METRIC RANK
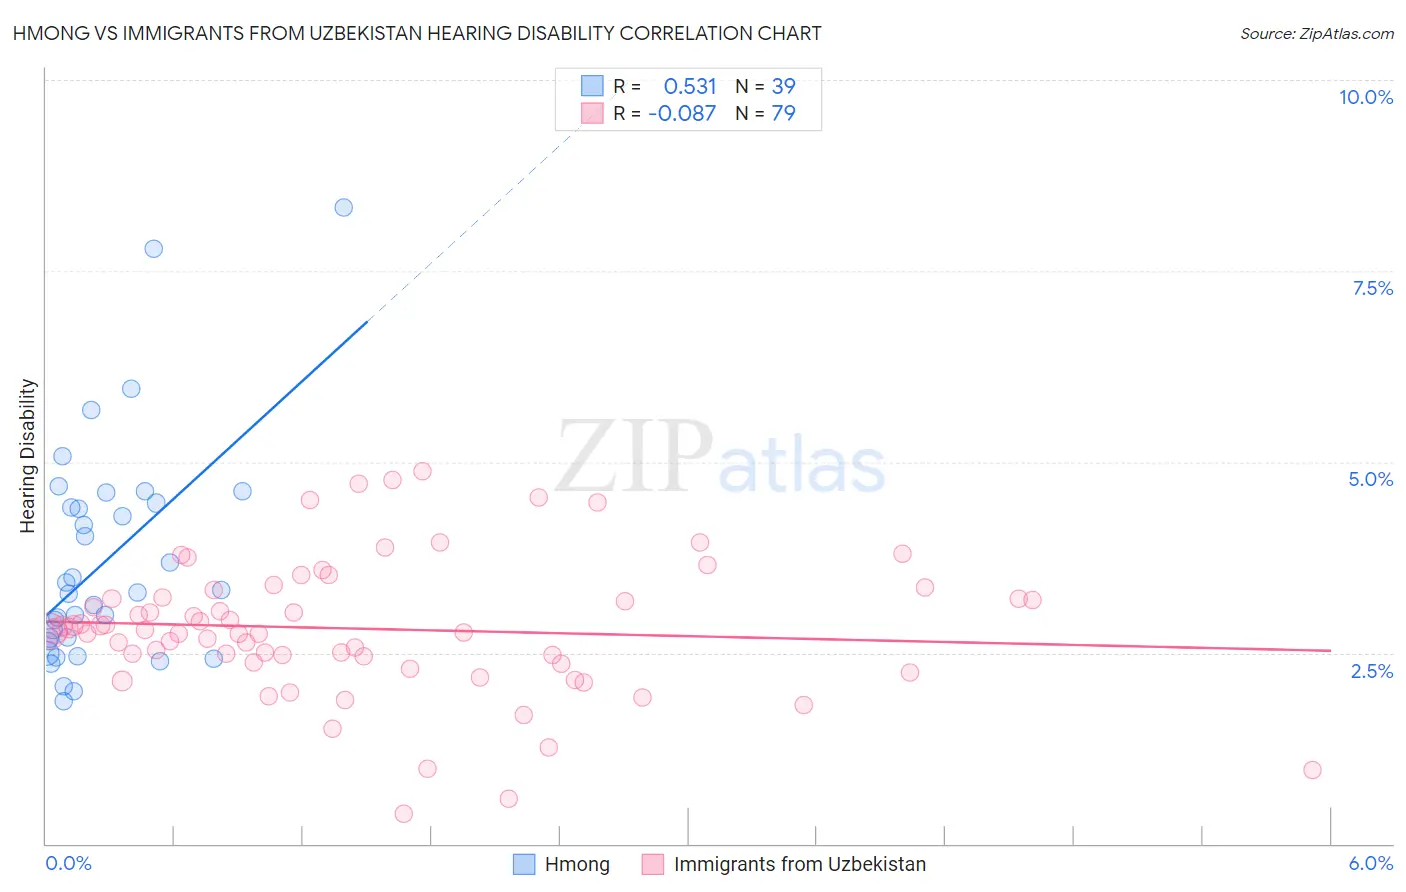
Hmong vs Immigrants from Uzbekistan Hearing Disability Correlation Chart
The statistical analysis conducted on geographies consisting of 24,680,511 people shows a substantial positive correlation between the proportion of Hmong and percentage of population with hearing disability in the United States with a correlation coefficient (R) of 0.531 and weighted average of 3.4%. Similarly, the statistical analysis conducted on geographies consisting of 118,732,772 people shows a slight negative correlation between the proportion of Immigrants from Uzbekistan and percentage of population with hearing disability in the United States with a correlation coefficient (R) of -0.087 and weighted average of 2.7%, a difference of 26.9%.
Hearing Disability Correlation Summary
| Measurement | Hmong | Immigrants from Uzbekistan |
| Minimum | 1.9% | 0.39% |
| Maximum | 8.3% | 4.9% |
| Range | 6.5% | 4.5% |
| Mean | 3.7% | 2.8% |
| Median | 3.3% | 2.8% |
| Interquartile 25% (IQ1) | 2.6% | 2.4% |
| Interquartile 75% (IQ3) | 4.5% | 3.2% |
| Interquartile Range (IQR) | 1.8% | 0.84% |
| Standard Deviation (Sample) | 1.5% | 0.89% |
| Standard Deviation (Population) | 1.4% | 0.88% |
Similar Demographics by Hearing Disability
Demographics Similar to Hmong by Hearing Disability
In terms of hearing disability, the demographic groups most similar to Hmong are Polish (3.4%, a difference of 0.040%), Slavic (3.4%, a difference of 0.27%), Yaqui (3.4%, a difference of 0.45%), Northern European (3.4%, a difference of 0.52%), and Carpatho Rusyn (3.4%, a difference of 0.70%).
| Demographics | Rating | Rank | Hearing Disability |
| Italians | 0.4 /100 | #249 | Tragic 3.4% |
| Yuman | 0.4 /100 | #250 | Tragic 3.4% |
| Hungarians | 0.4 /100 | #251 | Tragic 3.4% |
| Croatians | 0.4 /100 | #252 | Tragic 3.4% |
| Carpatho Rusyns | 0.3 /100 | #253 | Tragic 3.4% |
| Slavs | 0.2 /100 | #254 | Tragic 3.4% |
| Poles | 0.2 /100 | #255 | Tragic 3.4% |
| Hmong | 0.2 /100 | #256 | Tragic 3.4% |
| Yaqui | 0.2 /100 | #257 | Tragic 3.4% |
| Northern Europeans | 0.2 /100 | #258 | Tragic 3.4% |
| Slovenes | 0.1 /100 | #259 | Tragic 3.5% |
| Portuguese | 0.1 /100 | #260 | Tragic 3.5% |
| Hawaiians | 0.1 /100 | #261 | Tragic 3.5% |
| Immigrants | North America | 0.1 /100 | #262 | Tragic 3.5% |
| Immigrants | Canada | 0.1 /100 | #263 | Tragic 3.5% |
Demographics Similar to Immigrants from Uzbekistan by Hearing Disability
In terms of hearing disability, the demographic groups most similar to Immigrants from Uzbekistan are Immigrants from Colombia (2.7%, a difference of 0.0%), Indian (Asian) (2.7%, a difference of 0.060%), Immigrants from Sri Lanka (2.7%, a difference of 0.11%), Immigrants from Egypt (2.7%, a difference of 0.13%), and Immigrants from Nepal (2.7%, a difference of 0.19%).
| Demographics | Rating | Rank | Hearing Disability |
| Ethiopians | 99.0 /100 | #54 | Exceptional 2.7% |
| Immigrants | Ethiopia | 99.0 /100 | #55 | Exceptional 2.7% |
| Immigrants | Nicaragua | 99.0 /100 | #56 | Exceptional 2.7% |
| South Americans | 99.0 /100 | #57 | Exceptional 2.7% |
| Immigrants | Peru | 98.6 /100 | #58 | Exceptional 2.7% |
| Immigrants | Eritrea | 98.5 /100 | #59 | Exceptional 2.7% |
| Immigrants | Egypt | 98.5 /100 | #60 | Exceptional 2.7% |
| Immigrants | Uzbekistan | 98.4 /100 | #61 | Exceptional 2.7% |
| Immigrants | Colombia | 98.4 /100 | #62 | Exceptional 2.7% |
| Indians (Asian) | 98.4 /100 | #63 | Exceptional 2.7% |
| Immigrants | Sri Lanka | 98.4 /100 | #64 | Exceptional 2.7% |
| Immigrants | Nepal | 98.3 /100 | #65 | Exceptional 2.7% |
| Immigrants | Belize | 98.2 /100 | #66 | Exceptional 2.7% |
| Egyptians | 98.1 /100 | #67 | Exceptional 2.7% |
| Immigrants | Africa | 98.0 /100 | #68 | Exceptional 2.7% |