Hmong vs Yaqui Disability Age 5 to 17
COMPARE
Hmong
Yaqui
Disability Age 5 to 17
Disability Age 5 to 17 Comparison
Hmong
Yaqui
6.3%
DISABILITY AGE 5 TO 17
0.0/ 100
METRIC RATING
309th/ 347
METRIC RANK
6.2%
DISABILITY AGE 5 TO 17
0.0/ 100
METRIC RATING
289th/ 347
METRIC RANK
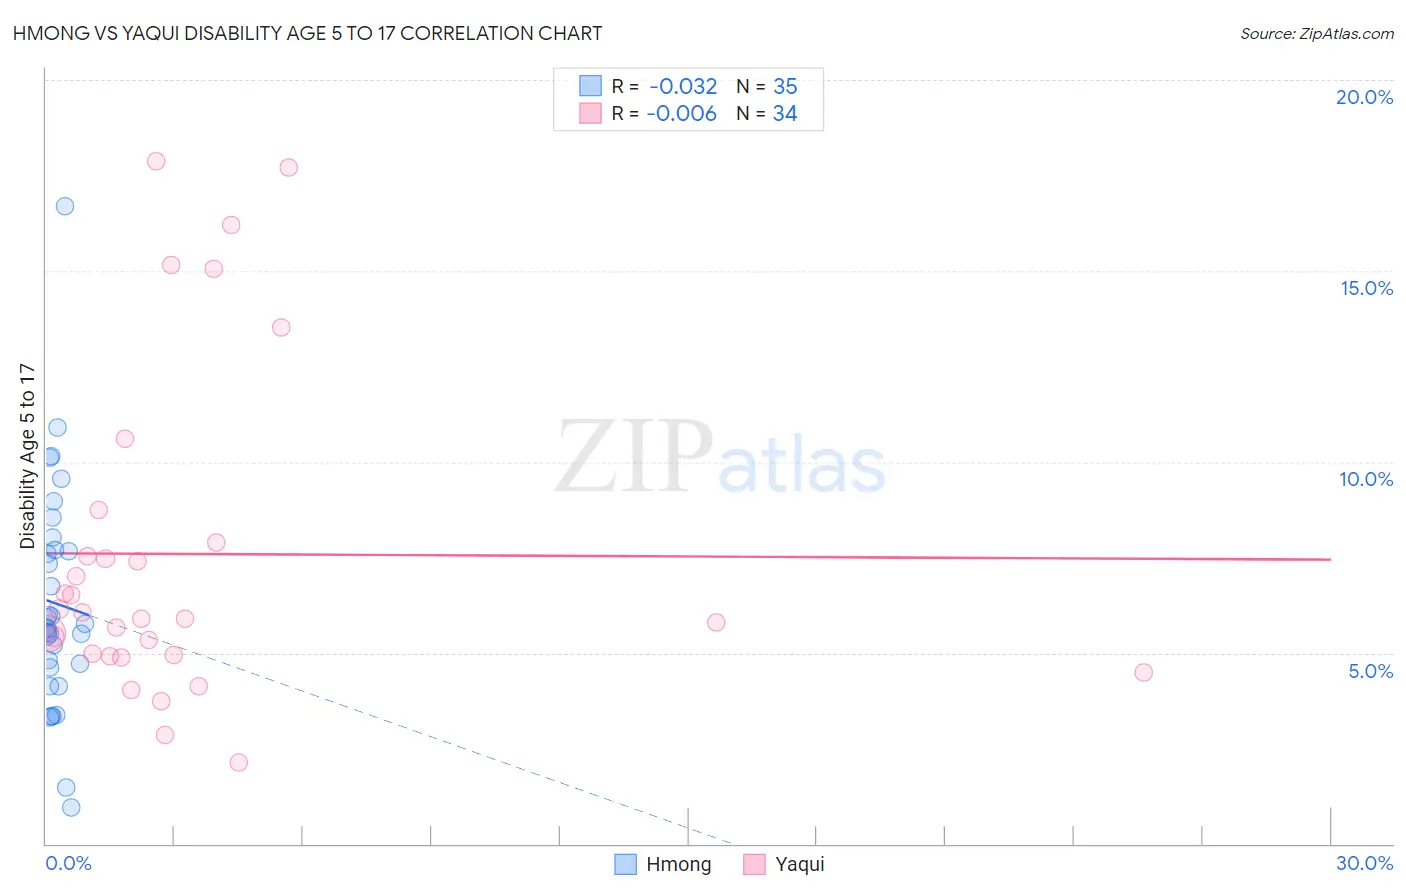
Hmong vs Yaqui Disability Age 5 to 17 Correlation Chart
The statistical analysis conducted on geographies consisting of 24,665,493 people shows no correlation between the proportion of Hmong and percentage of population with a disability between the ages 5 and 17 in the United States with a correlation coefficient (R) of -0.032 and weighted average of 6.3%. Similarly, the statistical analysis conducted on geographies consisting of 107,446,571 people shows no correlation between the proportion of Yaqui and percentage of population with a disability between the ages 5 and 17 in the United States with a correlation coefficient (R) of -0.006 and weighted average of 6.2%, a difference of 2.4%.
Disability Age 5 to 17 Correlation Summary
| Measurement | Hmong | Yaqui |
| Minimum | 0.96% | 2.1% |
| Maximum | 16.7% | 17.9% |
| Range | 15.7% | 15.7% |
| Mean | 6.3% | 7.6% |
| Median | 5.7% | 6.0% |
| Interquartile 25% (IQ1) | 4.6% | 4.9% |
| Interquartile 75% (IQ3) | 7.7% | 7.9% |
| Interquartile Range (IQR) | 3.1% | 2.9% |
| Standard Deviation (Sample) | 3.0% | 4.3% |
| Standard Deviation (Population) | 2.9% | 4.2% |
Demographics Similar to Hmong and Yaqui by Disability Age 5 to 17
In terms of disability age 5 to 17, the demographic groups most similar to Hmong are Scotch-Irish (6.3%, a difference of 0.020%), Bahamian (6.3%, a difference of 0.26%), Nonimmigrants (6.3%, a difference of 0.40%), Native/Alaskan (6.3%, a difference of 0.50%), and Senegalese (6.3%, a difference of 0.64%). Similarly, the demographic groups most similar to Yaqui are Immigrants from Congo (6.2%, a difference of 0.0%), White/Caucasian (6.2%, a difference of 0.15%), Immigrants from Senegal (6.2%, a difference of 0.39%), Central American Indian (6.2%, a difference of 0.41%), and Irish (6.2%, a difference of 0.41%).
| Demographics | Rating | Rank | Disability Age 5 to 17 |
| Yaqui | 0.0 /100 | #289 | Tragic 6.2% |
| Immigrants | Congo | 0.0 /100 | #290 | Tragic 6.2% |
| Whites/Caucasians | 0.0 /100 | #291 | Tragic 6.2% |
| Immigrants | Senegal | 0.0 /100 | #292 | Tragic 6.2% |
| Central American Indians | 0.0 /100 | #293 | Tragic 6.2% |
| Irish | 0.0 /100 | #294 | Tragic 6.2% |
| Cree | 0.0 /100 | #295 | Tragic 6.2% |
| Spanish Americans | 0.0 /100 | #296 | Tragic 6.2% |
| Immigrants | Bahamas | 0.0 /100 | #297 | Tragic 6.2% |
| Lumbee | 0.0 /100 | #298 | Tragic 6.2% |
| Welsh | 0.0 /100 | #299 | Tragic 6.3% |
| Carpatho Rusyns | 0.0 /100 | #300 | Tragic 6.3% |
| U.S. Virgin Islanders | 0.0 /100 | #301 | Tragic 6.3% |
| Celtics | 0.0 /100 | #302 | Tragic 6.3% |
| Yakama | 0.0 /100 | #303 | Tragic 6.3% |
| Senegalese | 0.0 /100 | #304 | Tragic 6.3% |
| Natives/Alaskans | 0.0 /100 | #305 | Tragic 6.3% |
| Immigrants | Nonimmigrants | 0.0 /100 | #306 | Tragic 6.3% |
| Bahamians | 0.0 /100 | #307 | Tragic 6.3% |
| Scotch-Irish | 0.0 /100 | #308 | Tragic 6.3% |
| Hmong | 0.0 /100 | #309 | Tragic 6.3% |