Hmong vs Immigrants from Ethiopia In Labor Force | Age 35-44
COMPARE
Hmong
Immigrants from Ethiopia
In Labor Force | Age 35-44
In Labor Force | Age 35-44 Comparison
Hmong
Immigrants from Ethiopia
82.6%
IN LABOR FORCE | AGE 35-44
0.0/ 100
METRIC RATING
297th/ 347
METRIC RANK
85.9%
IN LABOR FORCE | AGE 35-44
100.0/ 100
METRIC RATING
8th/ 347
METRIC RANK
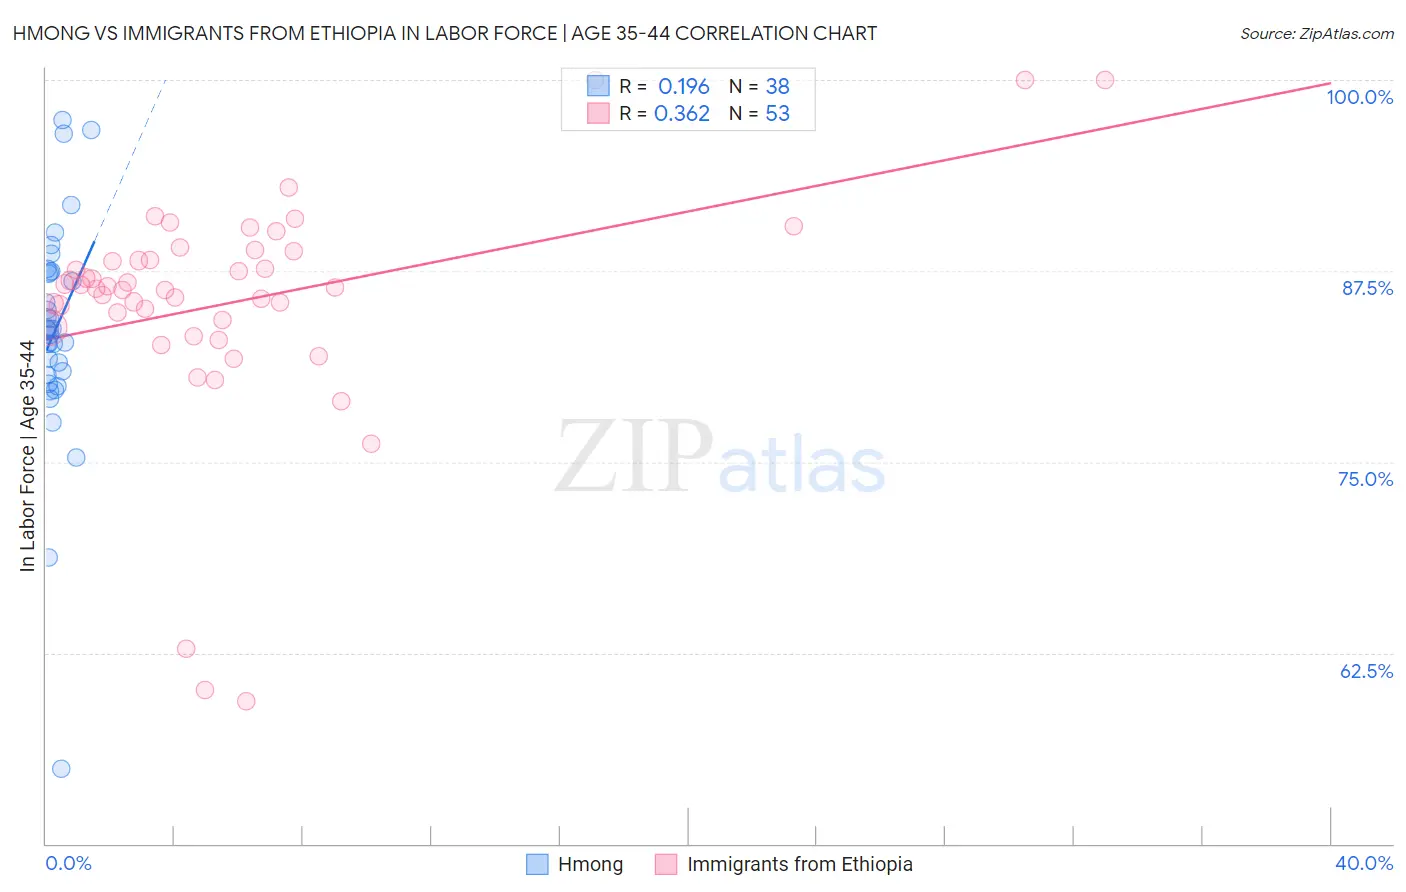
Hmong vs Immigrants from Ethiopia In Labor Force | Age 35-44 Correlation Chart
The statistical analysis conducted on geographies consisting of 24,669,739 people shows a poor positive correlation between the proportion of Hmong and labor force participation rate among population between the ages 35 and 44 in the United States with a correlation coefficient (R) of 0.196 and weighted average of 82.6%. Similarly, the statistical analysis conducted on geographies consisting of 211,503,517 people shows a mild positive correlation between the proportion of Immigrants from Ethiopia and labor force participation rate among population between the ages 35 and 44 in the United States with a correlation coefficient (R) of 0.362 and weighted average of 85.9%, a difference of 4.0%.
In Labor Force | Age 35-44 Correlation Summary
| Measurement | Hmong | Immigrants from Ethiopia |
| Minimum | 54.9% | 59.3% |
| Maximum | 97.4% | 100.0% |
| Range | 42.5% | 40.7% |
| Mean | 83.6% | 85.5% |
| Median | 83.7% | 86.4% |
| Interquartile 25% (IQ1) | 80.7% | 84.1% |
| Interquartile 75% (IQ3) | 87.4% | 88.5% |
| Interquartile Range (IQR) | 6.7% | 4.4% |
| Standard Deviation (Sample) | 7.4% | 7.6% |
| Standard Deviation (Population) | 7.3% | 7.5% |
Similar Demographics by In Labor Force | Age 35-44
Demographics Similar to Hmong by In Labor Force | Age 35-44
In terms of in labor force | age 35-44, the demographic groups most similar to Hmong are Mexican American Indian (82.6%, a difference of 0.010%), Ottawa (82.6%, a difference of 0.020%), Tlingit-Haida (82.5%, a difference of 0.030%), Central American Indian (82.5%, a difference of 0.090%), and Immigrants from Lebanon (82.7%, a difference of 0.10%).
| Demographics | Rating | Rank | In Labor Force | Age 35-44 |
| Africans | 0.0 /100 | #290 | Tragic 82.9% |
| Pennsylvania Germans | 0.0 /100 | #291 | Tragic 82.9% |
| Immigrants | Latin America | 0.0 /100 | #292 | Tragic 82.8% |
| Spanish Americans | 0.0 /100 | #293 | Tragic 82.8% |
| Potawatomi | 0.0 /100 | #294 | Tragic 82.7% |
| Immigrants | Lebanon | 0.0 /100 | #295 | Tragic 82.7% |
| Mexican American Indians | 0.0 /100 | #296 | Tragic 82.6% |
| Hmong | 0.0 /100 | #297 | Tragic 82.6% |
| Ottawa | 0.0 /100 | #298 | Tragic 82.6% |
| Tlingit-Haida | 0.0 /100 | #299 | Tragic 82.5% |
| Central American Indians | 0.0 /100 | #300 | Tragic 82.5% |
| Spanish American Indians | 0.0 /100 | #301 | Tragic 82.5% |
| Americans | 0.0 /100 | #302 | Tragic 82.4% |
| Nepalese | 0.0 /100 | #303 | Tragic 82.4% |
| Marshallese | 0.0 /100 | #304 | Tragic 82.4% |
Demographics Similar to Immigrants from Ethiopia by In Labor Force | Age 35-44
In terms of in labor force | age 35-44, the demographic groups most similar to Immigrants from Ethiopia are Ethiopian (85.9%, a difference of 0.0%), Cape Verdean (85.8%, a difference of 0.13%), Immigrants from Cameroon (85.8%, a difference of 0.16%), Immigrants from Sierra Leone (86.1%, a difference of 0.17%), and Bolivian (86.1%, a difference of 0.21%).
| Demographics | Rating | Rank | In Labor Force | Age 35-44 |
| Sierra Leoneans | 100.0 /100 | #1 | Exceptional 86.4% |
| Luxembourgers | 100.0 /100 | #2 | Exceptional 86.4% |
| Immigrants | Bolivia | 100.0 /100 | #3 | Exceptional 86.2% |
| Immigrants | Cabo Verde | 100.0 /100 | #4 | Exceptional 86.2% |
| Zimbabweans | 100.0 /100 | #5 | Exceptional 86.1% |
| Bolivians | 100.0 /100 | #6 | Exceptional 86.1% |
| Immigrants | Sierra Leone | 100.0 /100 | #7 | Exceptional 86.1% |
| Immigrants | Ethiopia | 100.0 /100 | #8 | Exceptional 85.9% |
| Ethiopians | 100.0 /100 | #9 | Exceptional 85.9% |
| Cape Verdeans | 100.0 /100 | #10 | Exceptional 85.8% |
| Immigrants | Cameroon | 100.0 /100 | #11 | Exceptional 85.8% |
| Liberians | 100.0 /100 | #12 | Exceptional 85.7% |
| Somalis | 100.0 /100 | #13 | Exceptional 85.6% |
| Immigrants | Somalia | 100.0 /100 | #14 | Exceptional 85.6% |
| Norwegians | 100.0 /100 | #15 | Exceptional 85.6% |