Hmong vs Sudanese Male Disability
COMPARE
Hmong
Sudanese
Male Disability
Male Disability Comparison
Hmong
Sudanese
12.5%
MALE DISABILITY
0.0/ 100
METRIC RATING
272nd/ 347
METRIC RANK
11.0%
MALE DISABILITY
77.1/ 100
METRIC RATING
148th/ 347
METRIC RANK
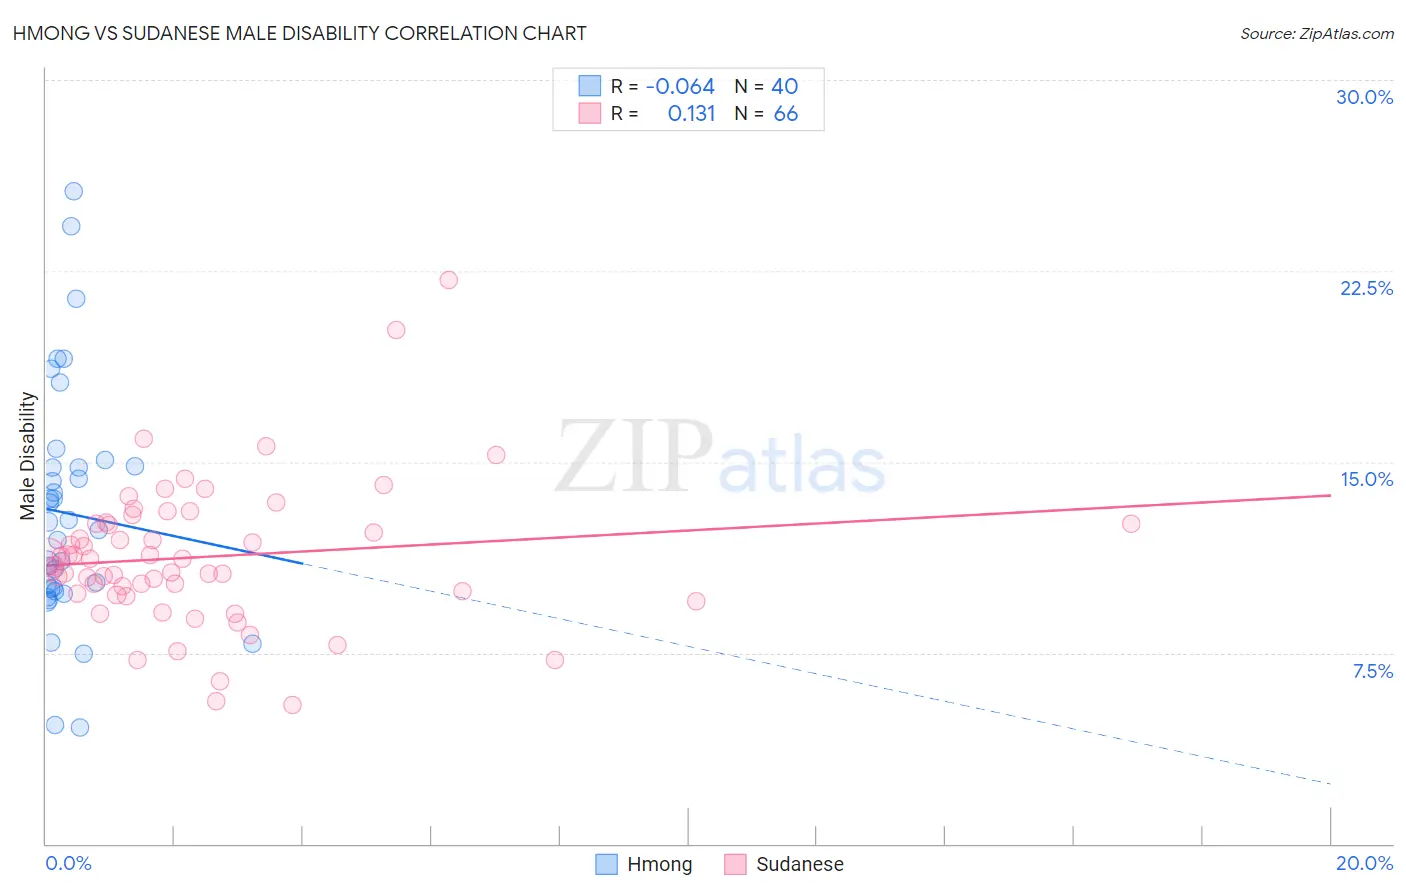
Hmong vs Sudanese Male Disability Correlation Chart
The statistical analysis conducted on geographies consisting of 24,681,537 people shows a slight negative correlation between the proportion of Hmong and percentage of males with a disability in the United States with a correlation coefficient (R) of -0.064 and weighted average of 12.5%. Similarly, the statistical analysis conducted on geographies consisting of 110,141,954 people shows a poor positive correlation between the proportion of Sudanese and percentage of males with a disability in the United States with a correlation coefficient (R) of 0.131 and weighted average of 11.0%, a difference of 13.1%.
Male Disability Correlation Summary
| Measurement | Hmong | Sudanese |
| Minimum | 4.6% | 5.5% |
| Maximum | 25.6% | 22.1% |
| Range | 21.1% | 16.7% |
| Mean | 13.0% | 11.3% |
| Median | 12.5% | 11.1% |
| Interquartile 25% (IQ1) | 10.0% | 9.8% |
| Interquartile 75% (IQ3) | 14.8% | 12.6% |
| Interquartile Range (IQR) | 4.8% | 2.7% |
| Standard Deviation (Sample) | 4.7% | 2.8% |
| Standard Deviation (Population) | 4.6% | 2.8% |
Similar Demographics by Male Disability
Demographics Similar to Hmong by Male Disability
In terms of male disability, the demographic groups most similar to Hmong are Native Hawaiian (12.5%, a difference of 0.060%), Hopi (12.5%, a difference of 0.39%), Fijian (12.6%, a difference of 0.75%), African (12.6%, a difference of 0.80%), and Finnish (12.6%, a difference of 1.1%).
| Demographics | Rating | Rank | Male Disability |
| Immigrants | Portugal | 0.1 /100 | #265 | Tragic 12.3% |
| Hawaiians | 0.1 /100 | #266 | Tragic 12.3% |
| Immigrants | Germany | 0.1 /100 | #267 | Tragic 12.3% |
| Portuguese | 0.1 /100 | #268 | Tragic 12.3% |
| Czechoslovakians | 0.1 /100 | #269 | Tragic 12.3% |
| Spaniards | 0.1 /100 | #270 | Tragic 12.3% |
| Scandinavians | 0.1 /100 | #271 | Tragic 12.3% |
| Hmong | 0.0 /100 | #272 | Tragic 12.5% |
| Native Hawaiians | 0.0 /100 | #273 | Tragic 12.5% |
| Hopi | 0.0 /100 | #274 | Tragic 12.5% |
| Fijians | 0.0 /100 | #275 | Tragic 12.6% |
| Africans | 0.0 /100 | #276 | Tragic 12.6% |
| Finns | 0.0 /100 | #277 | Tragic 12.6% |
| Central American Indians | 0.0 /100 | #278 | Tragic 12.7% |
| Slovaks | 0.0 /100 | #279 | Tragic 12.7% |
Demographics Similar to Sudanese by Male Disability
In terms of male disability, the demographic groups most similar to Sudanese are Immigrants from Croatia (11.0%, a difference of 0.010%), Korean (11.0%, a difference of 0.030%), Immigrants from Denmark (11.0%, a difference of 0.060%), Costa Rican (11.0%, a difference of 0.070%), and Kenyan (11.0%, a difference of 0.080%).
| Demographics | Rating | Rank | Male Disability |
| Arabs | 81.5 /100 | #141 | Excellent 11.0% |
| Immigrants | Sudan | 81.5 /100 | #142 | Excellent 11.0% |
| Moroccans | 80.7 /100 | #143 | Excellent 11.0% |
| Kenyans | 78.1 /100 | #144 | Good 11.0% |
| Costa Ricans | 78.0 /100 | #145 | Good 11.0% |
| Koreans | 77.5 /100 | #146 | Good 11.0% |
| Immigrants | Croatia | 77.3 /100 | #147 | Good 11.0% |
| Sudanese | 77.1 /100 | #148 | Good 11.0% |
| Immigrants | Denmark | 76.4 /100 | #149 | Good 11.0% |
| Immigrants | Guatemala | 75.1 /100 | #150 | Good 11.0% |
| Cubans | 74.9 /100 | #151 | Good 11.0% |
| Immigrants | Albania | 74.4 /100 | #152 | Good 11.0% |
| Immigrants | Northern Europe | 73.2 /100 | #153 | Good 11.1% |
| Immigrants | Moldova | 72.8 /100 | #154 | Good 11.1% |
| Immigrants | Middle Africa | 70.9 /100 | #155 | Good 11.1% |