Hmong vs Thai Male Disability
COMPARE
Hmong
Thai
Male Disability
Male Disability Comparison
Hmong
Thais
12.5%
MALE DISABILITY
0.0/ 100
METRIC RATING
272nd/ 347
METRIC RANK
9.2%
MALE DISABILITY
100.0/ 100
METRIC RATING
4th/ 347
METRIC RANK
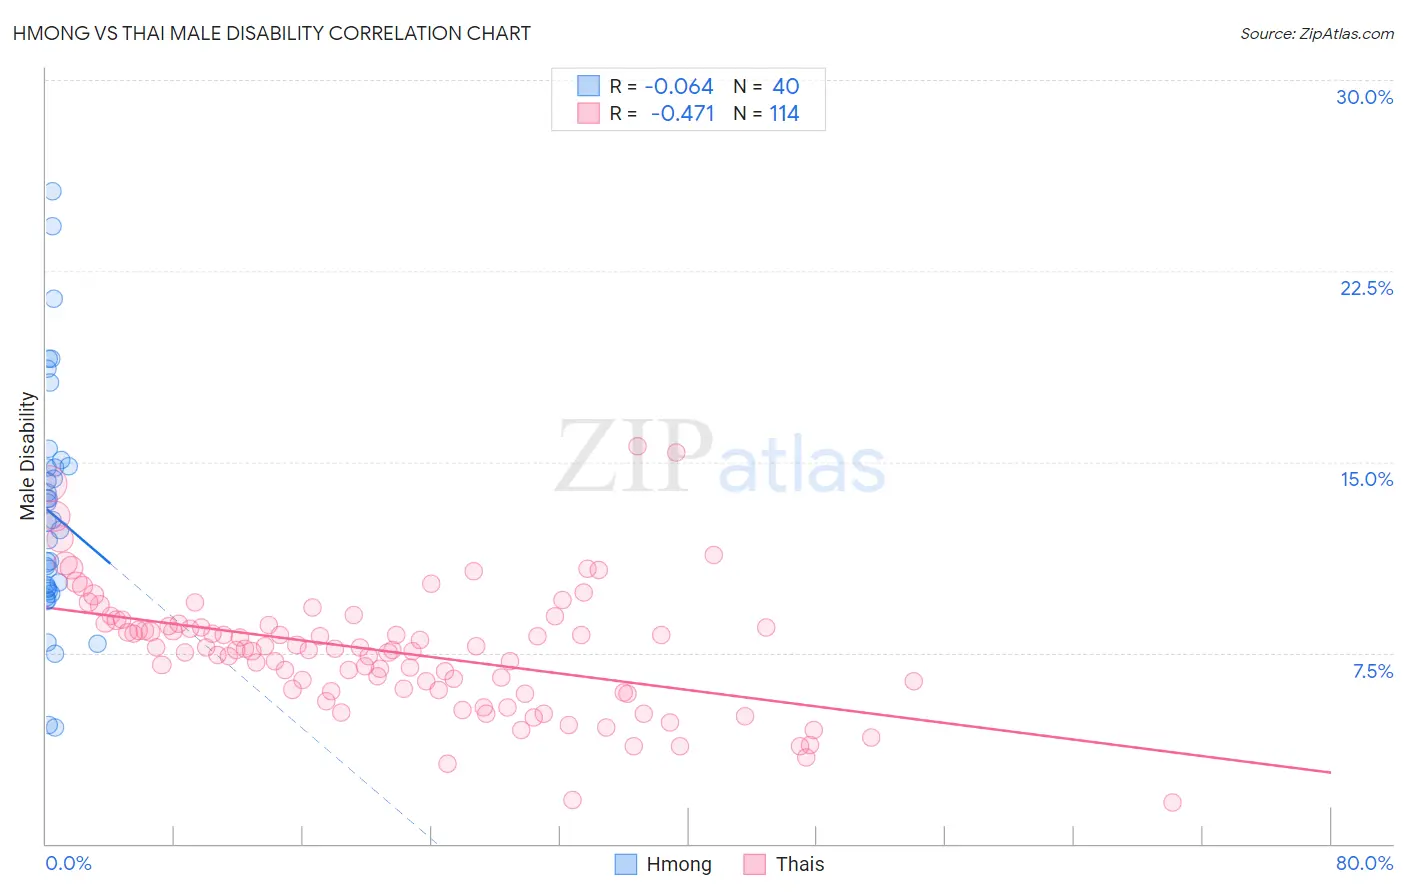
Hmong vs Thai Male Disability Correlation Chart
The statistical analysis conducted on geographies consisting of 24,681,537 people shows a slight negative correlation between the proportion of Hmong and percentage of males with a disability in the United States with a correlation coefficient (R) of -0.064 and weighted average of 12.5%. Similarly, the statistical analysis conducted on geographies consisting of 475,773,320 people shows a moderate negative correlation between the proportion of Thais and percentage of males with a disability in the United States with a correlation coefficient (R) of -0.471 and weighted average of 9.2%, a difference of 35.1%.
Male Disability Correlation Summary
| Measurement | Hmong | Thai |
| Minimum | 4.6% | 1.6% |
| Maximum | 25.6% | 15.6% |
| Range | 21.1% | 14.0% |
| Mean | 13.0% | 7.5% |
| Median | 12.5% | 7.6% |
| Interquartile 25% (IQ1) | 10.0% | 6.0% |
| Interquartile 75% (IQ3) | 14.8% | 8.6% |
| Interquartile Range (IQR) | 4.8% | 2.5% |
| Standard Deviation (Sample) | 4.7% | 2.4% |
| Standard Deviation (Population) | 4.6% | 2.4% |
Similar Demographics by Male Disability
Demographics Similar to Hmong by Male Disability
In terms of male disability, the demographic groups most similar to Hmong are Native Hawaiian (12.5%, a difference of 0.060%), Hopi (12.5%, a difference of 0.39%), Fijian (12.6%, a difference of 0.75%), African (12.6%, a difference of 0.80%), and Finnish (12.6%, a difference of 1.1%).
| Demographics | Rating | Rank | Male Disability |
| Immigrants | Portugal | 0.1 /100 | #265 | Tragic 12.3% |
| Hawaiians | 0.1 /100 | #266 | Tragic 12.3% |
| Immigrants | Germany | 0.1 /100 | #267 | Tragic 12.3% |
| Portuguese | 0.1 /100 | #268 | Tragic 12.3% |
| Czechoslovakians | 0.1 /100 | #269 | Tragic 12.3% |
| Spaniards | 0.1 /100 | #270 | Tragic 12.3% |
| Scandinavians | 0.1 /100 | #271 | Tragic 12.3% |
| Hmong | 0.0 /100 | #272 | Tragic 12.5% |
| Native Hawaiians | 0.0 /100 | #273 | Tragic 12.5% |
| Hopi | 0.0 /100 | #274 | Tragic 12.5% |
| Fijians | 0.0 /100 | #275 | Tragic 12.6% |
| Africans | 0.0 /100 | #276 | Tragic 12.6% |
| Finns | 0.0 /100 | #277 | Tragic 12.6% |
| Central American Indians | 0.0 /100 | #278 | Tragic 12.7% |
| Slovaks | 0.0 /100 | #279 | Tragic 12.7% |
Demographics Similar to Thais by Male Disability
In terms of male disability, the demographic groups most similar to Thais are Filipino (9.1%, a difference of 1.3%), Immigrants from Taiwan (9.1%, a difference of 1.3%), Immigrants from Hong Kong (9.4%, a difference of 2.1%), Immigrants from South Central Asia (9.4%, a difference of 2.2%), and Immigrants from India (9.0%, a difference of 2.2%).
| Demographics | Rating | Rank | Male Disability |
| Immigrants | India | 100.0 /100 | #1 | Exceptional 9.0% |
| Immigrants | Taiwan | 100.0 /100 | #2 | Exceptional 9.1% |
| Filipinos | 100.0 /100 | #3 | Exceptional 9.1% |
| Thais | 100.0 /100 | #4 | Exceptional 9.2% |
| Immigrants | Hong Kong | 100.0 /100 | #5 | Exceptional 9.4% |
| Immigrants | South Central Asia | 100.0 /100 | #6 | Exceptional 9.4% |
| Immigrants | Bolivia | 100.0 /100 | #7 | Exceptional 9.5% |
| Immigrants | China | 100.0 /100 | #8 | Exceptional 9.5% |
| Immigrants | Singapore | 100.0 /100 | #9 | Exceptional 9.5% |
| Immigrants | Israel | 100.0 /100 | #10 | Exceptional 9.6% |
| Immigrants | Eastern Asia | 100.0 /100 | #11 | Exceptional 9.6% |
| Bolivians | 100.0 /100 | #12 | Exceptional 9.6% |
| Iranians | 100.0 /100 | #13 | Exceptional 9.7% |
| Immigrants | Iran | 100.0 /100 | #14 | Exceptional 9.7% |
| Indians (Asian) | 100.0 /100 | #15 | Exceptional 9.7% |