Hispanic or Latino vs Blackfeet Disability
COMPARE
Hispanic or Latino
Blackfeet
Disability
Disability Comparison
Hispanics or Latinos
Blackfeet
12.1%
DISABILITY
3.9/ 100
METRIC RATING
223rd/ 347
METRIC RANK
13.6%
DISABILITY
0.0/ 100
METRIC RATING
310th/ 347
METRIC RANK
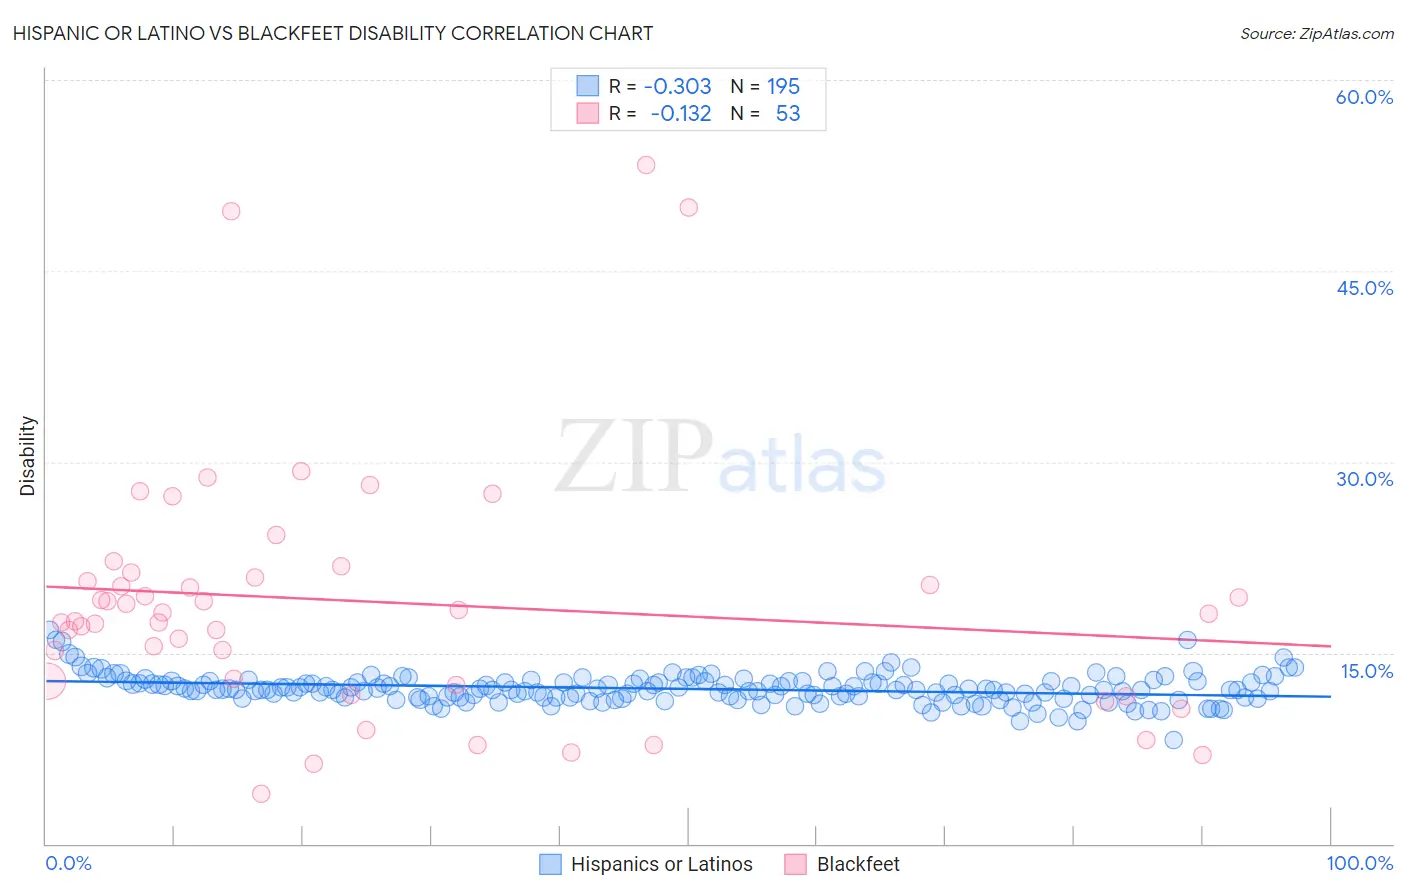
Hispanic or Latino vs Blackfeet Disability Correlation Chart
The statistical analysis conducted on geographies consisting of 572,941,997 people shows a mild negative correlation between the proportion of Hispanics or Latinos and percentage of population with a disability in the United States with a correlation coefficient (R) of -0.303 and weighted average of 12.1%. Similarly, the statistical analysis conducted on geographies consisting of 309,516,327 people shows a poor negative correlation between the proportion of Blackfeet and percentage of population with a disability in the United States with a correlation coefficient (R) of -0.132 and weighted average of 13.6%, a difference of 12.3%.
Disability Correlation Summary
| Measurement | Hispanic or Latino | Blackfeet |
| Minimum | 8.1% | 4.0% |
| Maximum | 16.8% | 53.3% |
| Range | 8.7% | 49.4% |
| Mean | 12.2% | 19.0% |
| Median | 12.1% | 18.1% |
| Interquartile 25% (IQ1) | 11.5% | 12.6% |
| Interquartile 75% (IQ3) | 12.7% | 21.1% |
| Interquartile Range (IQR) | 1.2% | 8.5% |
| Standard Deviation (Sample) | 1.1% | 10.0% |
| Standard Deviation (Population) | 1.1% | 9.9% |
Similar Demographics by Disability
Demographics Similar to Hispanics or Latinos by Disability
In terms of disability, the demographic groups most similar to Hispanics or Latinos are Spanish American Indian (12.1%, a difference of 0.040%), Mexican (12.1%, a difference of 0.060%), Northern European (12.1%, a difference of 0.070%), Senegalese (12.1%, a difference of 0.15%), and Immigrants from Bahamas (12.1%, a difference of 0.19%).
| Demographics | Rating | Rank | Disability |
| Panamanians | 5.4 /100 | #216 | Tragic 12.1% |
| Immigrants | North America | 5.3 /100 | #217 | Tragic 12.1% |
| Immigrants | Jamaica | 5.0 /100 | #218 | Tragic 12.1% |
| Croatians | 4.9 /100 | #219 | Tragic 12.1% |
| Immigrants | Bahamas | 4.7 /100 | #220 | Tragic 12.1% |
| Northern Europeans | 4.2 /100 | #221 | Tragic 12.1% |
| Spanish American Indians | 4.1 /100 | #222 | Tragic 12.1% |
| Hispanics or Latinos | 3.9 /100 | #223 | Tragic 12.1% |
| Mexicans | 3.7 /100 | #224 | Tragic 12.1% |
| Senegalese | 3.5 /100 | #225 | Tragic 12.1% |
| Jamaicans | 3.3 /100 | #226 | Tragic 12.1% |
| Alsatians | 3.3 /100 | #227 | Tragic 12.1% |
| West Indians | 2.9 /100 | #228 | Tragic 12.2% |
| Inupiat | 2.8 /100 | #229 | Tragic 12.2% |
| Samoans | 2.6 /100 | #230 | Tragic 12.2% |
Demographics Similar to Blackfeet by Disability
In terms of disability, the demographic groups most similar to Blackfeet are Delaware (13.6%, a difference of 0.040%), Spanish American (13.6%, a difference of 0.28%), Tlingit-Haida (13.5%, a difference of 0.53%), French American Indian (13.5%, a difference of 0.61%), and Cree (13.7%, a difference of 0.63%).
| Demographics | Rating | Rank | Disability |
| Scotch-Irish | 0.0 /100 | #303 | Tragic 13.3% |
| Yakama | 0.0 /100 | #304 | Tragic 13.4% |
| French Canadians | 0.0 /100 | #305 | Tragic 13.4% |
| Cape Verdeans | 0.0 /100 | #306 | Tragic 13.5% |
| Shoshone | 0.0 /100 | #307 | Tragic 13.5% |
| French American Indians | 0.0 /100 | #308 | Tragic 13.5% |
| Tlingit-Haida | 0.0 /100 | #309 | Tragic 13.5% |
| Blackfeet | 0.0 /100 | #310 | Tragic 13.6% |
| Delaware | 0.0 /100 | #311 | Tragic 13.6% |
| Spanish Americans | 0.0 /100 | #312 | Tragic 13.6% |
| Cree | 0.0 /100 | #313 | Tragic 13.7% |
| Blacks/African Americans | 0.0 /100 | #314 | Tragic 13.7% |
| Puget Sound Salish | 0.0 /100 | #315 | Tragic 13.7% |
| Pima | 0.0 /100 | #316 | Tragic 13.7% |
| Immigrants | Cabo Verde | 0.0 /100 | #317 | Tragic 13.7% |