Hawaiian vs Immigrants from Germany Hearing Disability
COMPARE
Hawaiian
Immigrants from Germany
Hearing Disability
Hearing Disability Comparison
Hawaiians
Immigrants from Germany
3.5%
HEARING DISABILITY
0.1/ 100
METRIC RATING
261st/ 347
METRIC RANK
3.5%
HEARING DISABILITY
0.1/ 100
METRIC RATING
264th/ 347
METRIC RANK
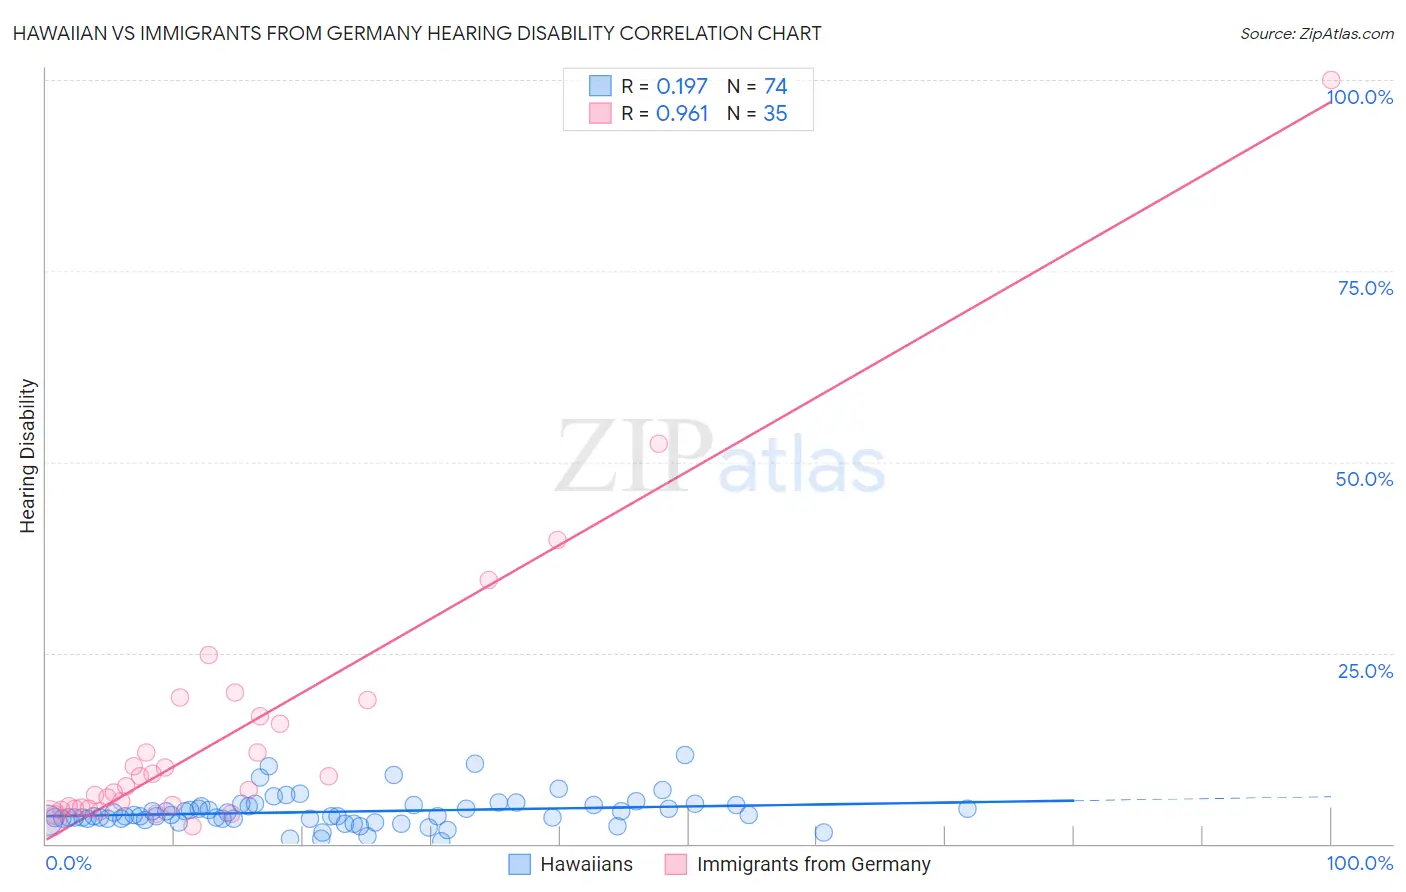
Hawaiian vs Immigrants from Germany Hearing Disability Correlation Chart
The statistical analysis conducted on geographies consisting of 327,393,622 people shows a poor positive correlation between the proportion of Hawaiians and percentage of population with hearing disability in the United States with a correlation coefficient (R) of 0.197 and weighted average of 3.5%. Similarly, the statistical analysis conducted on geographies consisting of 463,741,390 people shows a perfect positive correlation between the proportion of Immigrants from Germany and percentage of population with hearing disability in the United States with a correlation coefficient (R) of 0.961 and weighted average of 3.5%, a difference of 0.38%.
Hearing Disability Correlation Summary
| Measurement | Hawaiian | Immigrants from Germany |
| Minimum | 0.29% | 2.3% |
| Maximum | 11.6% | 100.0% |
| Range | 11.3% | 97.7% |
| Mean | 4.2% | 14.3% |
| Median | 3.7% | 7.5% |
| Interquartile 25% (IQ1) | 3.2% | 4.6% |
| Interquartile 75% (IQ3) | 5.0% | 16.7% |
| Interquartile Range (IQR) | 1.8% | 12.1% |
| Standard Deviation (Sample) | 2.1% | 18.6% |
| Standard Deviation (Population) | 2.1% | 18.3% |
Demographics Similar to Hawaiians and Immigrants from Germany by Hearing Disability
In terms of hearing disability, the demographic groups most similar to Hawaiians are Portuguese (3.5%, a difference of 0.040%), Slovene (3.5%, a difference of 0.11%), Immigrants from North America (3.5%, a difference of 0.11%), Immigrants from Canada (3.5%, a difference of 0.16%), and Northern European (3.4%, a difference of 0.35%). Similarly, the demographic groups most similar to Immigrants from Germany are British (3.5%, a difference of 0.020%), Belgian (3.5%, a difference of 0.20%), Immigrants from Canada (3.5%, a difference of 0.22%), Immigrants from North America (3.5%, a difference of 0.26%), and Portuguese (3.5%, a difference of 0.41%).
| Demographics | Rating | Rank | Hearing Disability |
| Croatians | 0.4 /100 | #252 | Tragic 3.4% |
| Carpatho Rusyns | 0.3 /100 | #253 | Tragic 3.4% |
| Slavs | 0.2 /100 | #254 | Tragic 3.4% |
| Poles | 0.2 /100 | #255 | Tragic 3.4% |
| Hmong | 0.2 /100 | #256 | Tragic 3.4% |
| Yaqui | 0.2 /100 | #257 | Tragic 3.4% |
| Northern Europeans | 0.2 /100 | #258 | Tragic 3.4% |
| Slovenes | 0.1 /100 | #259 | Tragic 3.5% |
| Portuguese | 0.1 /100 | #260 | Tragic 3.5% |
| Hawaiians | 0.1 /100 | #261 | Tragic 3.5% |
| Immigrants | North America | 0.1 /100 | #262 | Tragic 3.5% |
| Immigrants | Canada | 0.1 /100 | #263 | Tragic 3.5% |
| Immigrants | Germany | 0.1 /100 | #264 | Tragic 3.5% |
| British | 0.1 /100 | #265 | Tragic 3.5% |
| Belgians | 0.1 /100 | #266 | Tragic 3.5% |
| Canadians | 0.1 /100 | #267 | Tragic 3.5% |
| Spaniards | 0.1 /100 | #268 | Tragic 3.5% |
| Ute | 0.1 /100 | #269 | Tragic 3.5% |
| Europeans | 0.1 /100 | #270 | Tragic 3.5% |
| Czechs | 0.1 /100 | #271 | Tragic 3.5% |
| Fijians | 0.0 /100 | #272 | Tragic 3.5% |