Hawaiian vs Menominee 6th Grade
COMPARE
Hawaiian
Menominee
6th Grade
6th Grade Comparison
Hawaiians
Menominee
96.9%
6TH GRADE
27.0/ 100
METRIC RATING
192nd/ 347
METRIC RANK
97.5%
6TH GRADE
97.7/ 100
METRIC RATING
106th/ 347
METRIC RANK
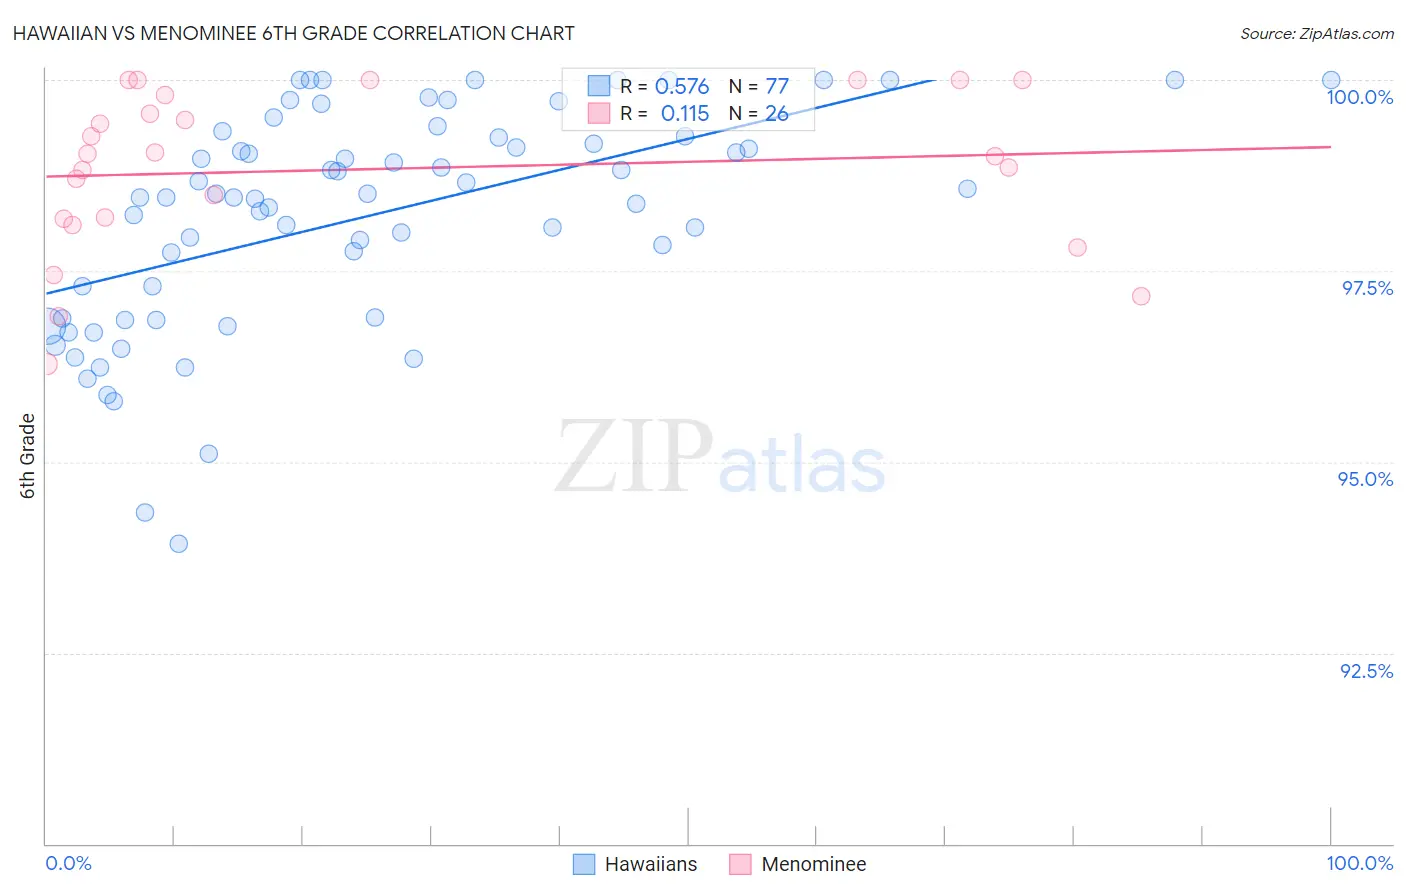
Hawaiian vs Menominee 6th Grade Correlation Chart
The statistical analysis conducted on geographies consisting of 327,621,279 people shows a substantial positive correlation between the proportion of Hawaiians and percentage of population with at least 6th grade education in the United States with a correlation coefficient (R) of 0.576 and weighted average of 96.9%. Similarly, the statistical analysis conducted on geographies consisting of 45,778,979 people shows a poor positive correlation between the proportion of Menominee and percentage of population with at least 6th grade education in the United States with a correlation coefficient (R) of 0.115 and weighted average of 97.5%, a difference of 0.54%.
6th Grade Correlation Summary
| Measurement | Hawaiian | Menominee |
| Minimum | 93.9% | 96.3% |
| Maximum | 100.0% | 100.0% |
| Range | 6.1% | 3.7% |
| Mean | 98.2% | 98.8% |
| Median | 98.5% | 99.0% |
| Interquartile 25% (IQ1) | 96.9% | 98.2% |
| Interquartile 75% (IQ3) | 99.3% | 99.8% |
| Interquartile Range (IQR) | 2.4% | 1.6% |
| Standard Deviation (Sample) | 1.4% | 1.1% |
| Standard Deviation (Population) | 1.4% | 1.0% |
Similar Demographics by 6th Grade
Demographics Similar to Hawaiians by 6th Grade
In terms of 6th grade, the demographic groups most similar to Hawaiians are Panamanian (96.9%, a difference of 0.0%), Paraguayan (96.9%, a difference of 0.0%), Dutch West Indian (96.9%, a difference of 0.010%), Immigrants from Lebanon (96.9%, a difference of 0.010%), and Immigrants from Brazil (96.9%, a difference of 0.010%).
| Demographics | Rating | Rank | 6th Grade |
| Argentineans | 33.0 /100 | #185 | Fair 97.0% |
| Immigrants | Egypt | 31.4 /100 | #186 | Fair 97.0% |
| Guamanians/Chamorros | 30.6 /100 | #187 | Fair 97.0% |
| Immigrants | Argentina | 30.4 /100 | #188 | Fair 97.0% |
| Blacks/African Americans | 30.2 /100 | #189 | Fair 97.0% |
| Dutch West Indians | 28.3 /100 | #190 | Fair 96.9% |
| Panamanians | 27.3 /100 | #191 | Fair 96.9% |
| Hawaiians | 27.0 /100 | #192 | Fair 96.9% |
| Paraguayans | 26.6 /100 | #193 | Fair 96.9% |
| Immigrants | Lebanon | 25.6 /100 | #194 | Fair 96.9% |
| Immigrants | Brazil | 25.5 /100 | #195 | Fair 96.9% |
| Immigrants | Uganda | 21.2 /100 | #196 | Fair 96.9% |
| Brazilians | 20.1 /100 | #197 | Fair 96.9% |
| Immigrants | Albania | 18.8 /100 | #198 | Poor 96.9% |
| Immigrants | Northern Africa | 15.7 /100 | #199 | Poor 96.9% |
Demographics Similar to Menominee by 6th Grade
In terms of 6th grade, the demographic groups most similar to Menominee are Choctaw (97.5%, a difference of 0.010%), Bhutanese (97.5%, a difference of 0.010%), German Russian (97.5%, a difference of 0.010%), Cheyenne (97.5%, a difference of 0.010%), and Immigrants from Singapore (97.5%, a difference of 0.010%).
| Demographics | Rating | Rank | 6th Grade |
| Yugoslavians | 98.5 /100 | #99 | Exceptional 97.5% |
| Turks | 98.3 /100 | #100 | Exceptional 97.5% |
| South Africans | 98.2 /100 | #101 | Exceptional 97.5% |
| Choctaw | 98.0 /100 | #102 | Exceptional 97.5% |
| Bhutanese | 98.0 /100 | #103 | Exceptional 97.5% |
| German Russians | 97.9 /100 | #104 | Exceptional 97.5% |
| Cheyenne | 97.9 /100 | #105 | Exceptional 97.5% |
| Menominee | 97.7 /100 | #106 | Exceptional 97.5% |
| Immigrants | Singapore | 97.6 /100 | #107 | Exceptional 97.5% |
| Immigrants | Nonimmigrants | 97.3 /100 | #108 | Exceptional 97.4% |
| Immigrants | Czechoslovakia | 97.3 /100 | #109 | Exceptional 97.4% |
| Thais | 96.9 /100 | #110 | Exceptional 97.4% |
| Iroquois | 96.9 /100 | #111 | Exceptional 97.4% |
| Immigrants | Latvia | 96.7 /100 | #112 | Exceptional 97.4% |
| Immigrants | Saudi Arabia | 96.5 /100 | #113 | Exceptional 97.4% |