Hawaiian vs Yuman Hearing Disability
COMPARE
Hawaiian
Yuman
Hearing Disability
Hearing Disability Comparison
Hawaiians
Yuman
3.5%
HEARING DISABILITY
0.1/ 100
METRIC RATING
261st/ 347
METRIC RANK
3.4%
HEARING DISABILITY
0.4/ 100
METRIC RATING
250th/ 347
METRIC RANK
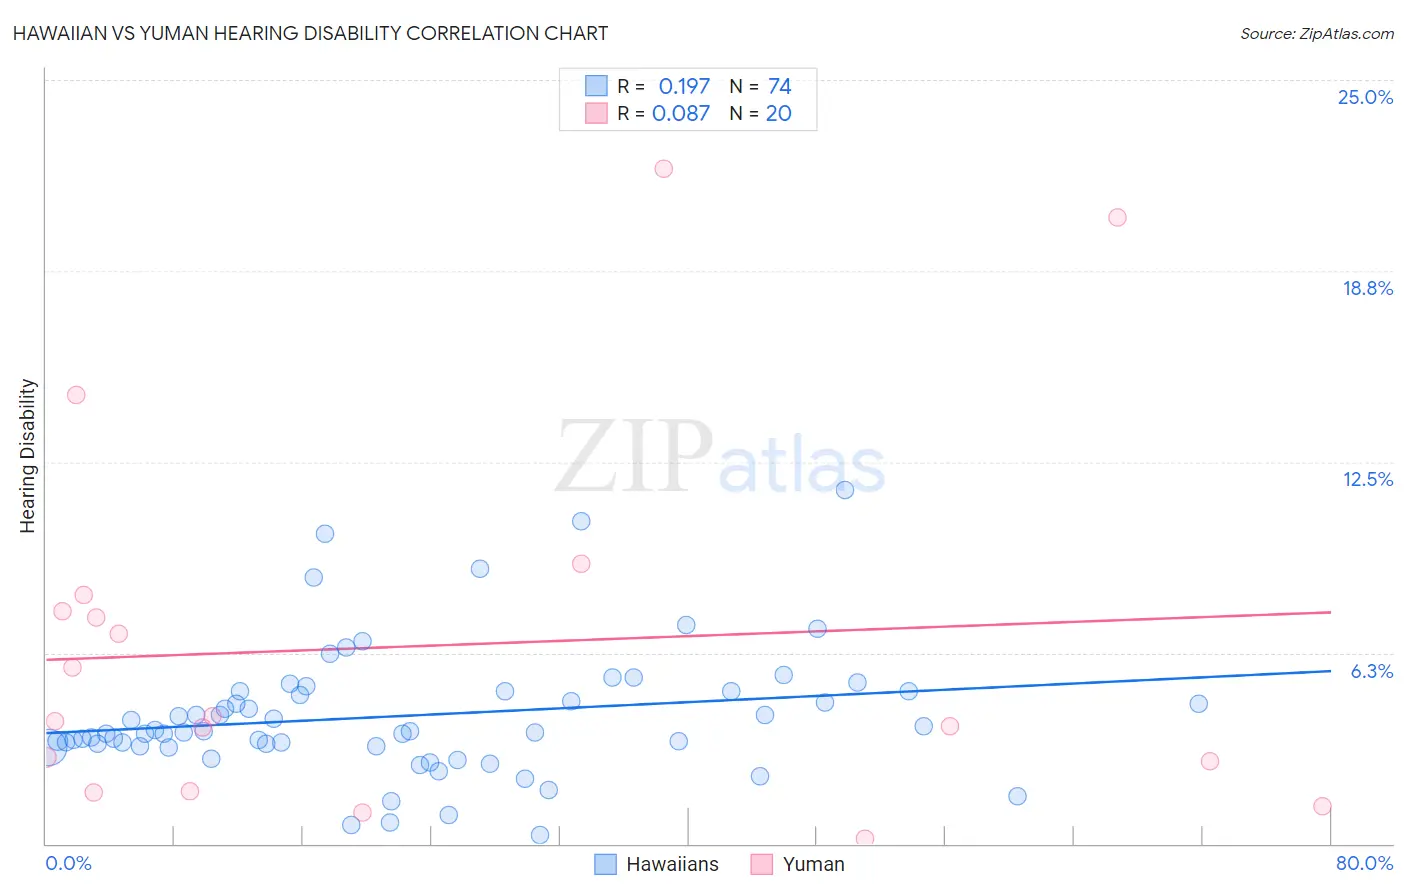
Hawaiian vs Yuman Hearing Disability Correlation Chart
The statistical analysis conducted on geographies consisting of 327,393,622 people shows a poor positive correlation between the proportion of Hawaiians and percentage of population with hearing disability in the United States with a correlation coefficient (R) of 0.197 and weighted average of 3.5%. Similarly, the statistical analysis conducted on geographies consisting of 40,662,882 people shows a slight positive correlation between the proportion of Yuman and percentage of population with hearing disability in the United States with a correlation coefficient (R) of 0.087 and weighted average of 3.4%, a difference of 2.5%.
Hearing Disability Correlation Summary
| Measurement | Hawaiian | Yuman |
| Minimum | 0.29% | 0.16% |
| Maximum | 11.6% | 22.1% |
| Range | 11.3% | 22.0% |
| Mean | 4.2% | 6.5% |
| Median | 3.7% | 4.1% |
| Interquartile 25% (IQ1) | 3.2% | 2.2% |
| Interquartile 75% (IQ3) | 5.0% | 7.9% |
| Interquartile Range (IQR) | 1.8% | 5.7% |
| Standard Deviation (Sample) | 2.1% | 6.1% |
| Standard Deviation (Population) | 2.1% | 6.0% |
Demographics Similar to Hawaiians and Yuman by Hearing Disability
In terms of hearing disability, the demographic groups most similar to Hawaiians are Portuguese (3.5%, a difference of 0.040%), Slovene (3.5%, a difference of 0.11%), Immigrants from North America (3.5%, a difference of 0.11%), Immigrants from Canada (3.5%, a difference of 0.16%), and Northern European (3.4%, a difference of 0.35%). Similarly, the demographic groups most similar to Yuman are Italian (3.4%, a difference of 0.010%), Hungarian (3.4%, a difference of 0.23%), Croatian (3.4%, a difference of 0.44%), Austrian (3.4%, a difference of 0.54%), and Lithuanian (3.4%, a difference of 0.76%).
| Demographics | Rating | Rank | Hearing Disability |
| Immigrants | Scotland | 0.8 /100 | #245 | Tragic 3.3% |
| Immigrants | England | 0.7 /100 | #246 | Tragic 3.3% |
| Lithuanians | 0.6 /100 | #247 | Tragic 3.4% |
| Austrians | 0.6 /100 | #248 | Tragic 3.4% |
| Italians | 0.4 /100 | #249 | Tragic 3.4% |
| Yuman | 0.4 /100 | #250 | Tragic 3.4% |
| Hungarians | 0.4 /100 | #251 | Tragic 3.4% |
| Croatians | 0.4 /100 | #252 | Tragic 3.4% |
| Carpatho Rusyns | 0.3 /100 | #253 | Tragic 3.4% |
| Slavs | 0.2 /100 | #254 | Tragic 3.4% |
| Poles | 0.2 /100 | #255 | Tragic 3.4% |
| Hmong | 0.2 /100 | #256 | Tragic 3.4% |
| Yaqui | 0.2 /100 | #257 | Tragic 3.4% |
| Northern Europeans | 0.2 /100 | #258 | Tragic 3.4% |
| Slovenes | 0.1 /100 | #259 | Tragic 3.5% |
| Portuguese | 0.1 /100 | #260 | Tragic 3.5% |
| Hawaiians | 0.1 /100 | #261 | Tragic 3.5% |
| Immigrants | North America | 0.1 /100 | #262 | Tragic 3.5% |
| Immigrants | Canada | 0.1 /100 | #263 | Tragic 3.5% |
| Immigrants | Germany | 0.1 /100 | #264 | Tragic 3.5% |
| British | 0.1 /100 | #265 | Tragic 3.5% |