Hawaiian vs Nonimmigrants Hearing Disability
COMPARE
Hawaiian
Nonimmigrants
Hearing Disability
Hearing Disability Comparison
Hawaiians
Nonimmigrants
3.5%
HEARING DISABILITY
0.1/ 100
METRIC RATING
261st/ 347
METRIC RANK
3.6%
HEARING DISABILITY
0.0/ 100
METRIC RATING
277th/ 347
METRIC RANK
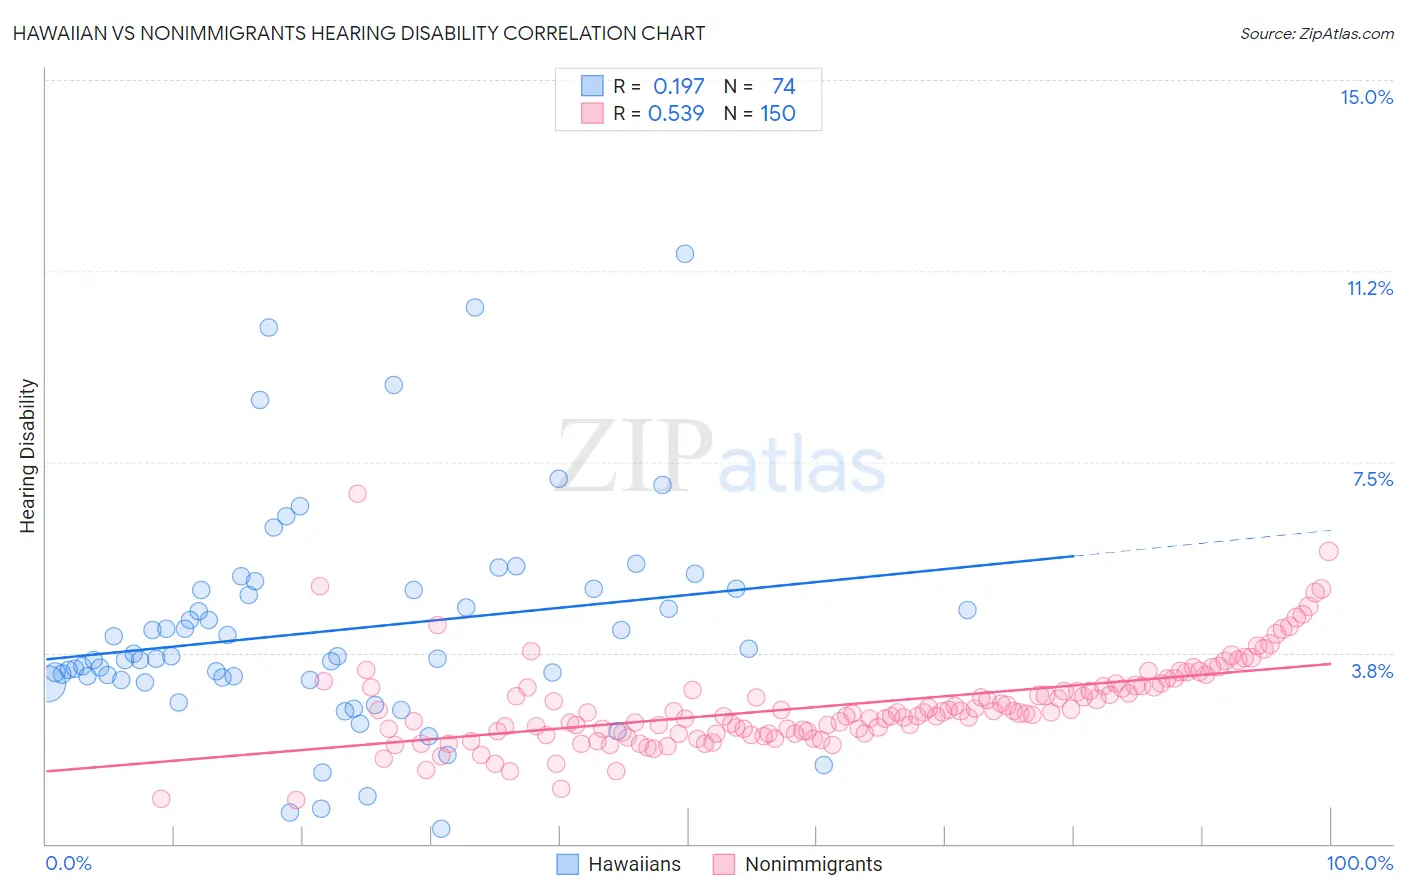
Hawaiian vs Nonimmigrants Hearing Disability Correlation Chart
The statistical analysis conducted on geographies consisting of 327,393,622 people shows a poor positive correlation between the proportion of Hawaiians and percentage of population with hearing disability in the United States with a correlation coefficient (R) of 0.197 and weighted average of 3.5%. Similarly, the statistical analysis conducted on geographies consisting of 583,885,168 people shows a substantial positive correlation between the proportion of Nonimmigrants and percentage of population with hearing disability in the United States with a correlation coefficient (R) of 0.539 and weighted average of 3.6%, a difference of 3.5%.
Hearing Disability Correlation Summary
| Measurement | Hawaiian | Nonimmigrants |
| Minimum | 0.29% | 0.87% |
| Maximum | 11.6% | 6.9% |
| Range | 11.3% | 6.0% |
| Mean | 4.2% | 2.7% |
| Median | 3.7% | 2.6% |
| Interquartile 25% (IQ1) | 3.2% | 2.2% |
| Interquartile 75% (IQ3) | 5.0% | 3.1% |
| Interquartile Range (IQR) | 1.8% | 0.92% |
| Standard Deviation (Sample) | 2.1% | 0.88% |
| Standard Deviation (Population) | 2.1% | 0.88% |
Demographics Similar to Hawaiians and Nonimmigrants by Hearing Disability
In terms of hearing disability, the demographic groups most similar to Hawaiians are Portuguese (3.5%, a difference of 0.040%), Slovene (3.5%, a difference of 0.11%), Immigrants from North America (3.5%, a difference of 0.11%), Immigrants from Canada (3.5%, a difference of 0.16%), and Immigrants from Germany (3.5%, a difference of 0.38%). Similarly, the demographic groups most similar to Nonimmigrants are Basque (3.6%, a difference of 0.39%), Slovak (3.6%, a difference of 0.65%), Danish (3.6%, a difference of 0.70%), Czechoslovakian (3.6%, a difference of 0.82%), and Swiss (3.5%, a difference of 1.0%).
| Demographics | Rating | Rank | Hearing Disability |
| Slovenes | 0.1 /100 | #259 | Tragic 3.5% |
| Portuguese | 0.1 /100 | #260 | Tragic 3.5% |
| Hawaiians | 0.1 /100 | #261 | Tragic 3.5% |
| Immigrants | North America | 0.1 /100 | #262 | Tragic 3.5% |
| Immigrants | Canada | 0.1 /100 | #263 | Tragic 3.5% |
| Immigrants | Germany | 0.1 /100 | #264 | Tragic 3.5% |
| British | 0.1 /100 | #265 | Tragic 3.5% |
| Belgians | 0.1 /100 | #266 | Tragic 3.5% |
| Canadians | 0.1 /100 | #267 | Tragic 3.5% |
| Spaniards | 0.1 /100 | #268 | Tragic 3.5% |
| Ute | 0.1 /100 | #269 | Tragic 3.5% |
| Europeans | 0.1 /100 | #270 | Tragic 3.5% |
| Czechs | 0.1 /100 | #271 | Tragic 3.5% |
| Fijians | 0.0 /100 | #272 | Tragic 3.5% |
| Puerto Ricans | 0.0 /100 | #273 | Tragic 3.5% |
| Swiss | 0.0 /100 | #274 | Tragic 3.5% |
| Czechoslovakians | 0.0 /100 | #275 | Tragic 3.6% |
| Danes | 0.0 /100 | #276 | Tragic 3.6% |
| Immigrants | Nonimmigrants | 0.0 /100 | #277 | Tragic 3.6% |
| Basques | 0.0 /100 | #278 | Tragic 3.6% |
| Slovaks | 0.0 /100 | #279 | Tragic 3.6% |