Guyanese vs Immigrants from Bulgaria Self-Care Disability
COMPARE
Guyanese
Immigrants from Bulgaria
Self-Care Disability
Self-Care Disability Comparison
Guyanese
Immigrants from Bulgaria
2.7%
SELF-CARE DISABILITY
0.0/ 100
METRIC RATING
291st/ 347
METRIC RANK
2.3%
SELF-CARE DISABILITY
99.8/ 100
METRIC RATING
39th/ 347
METRIC RANK
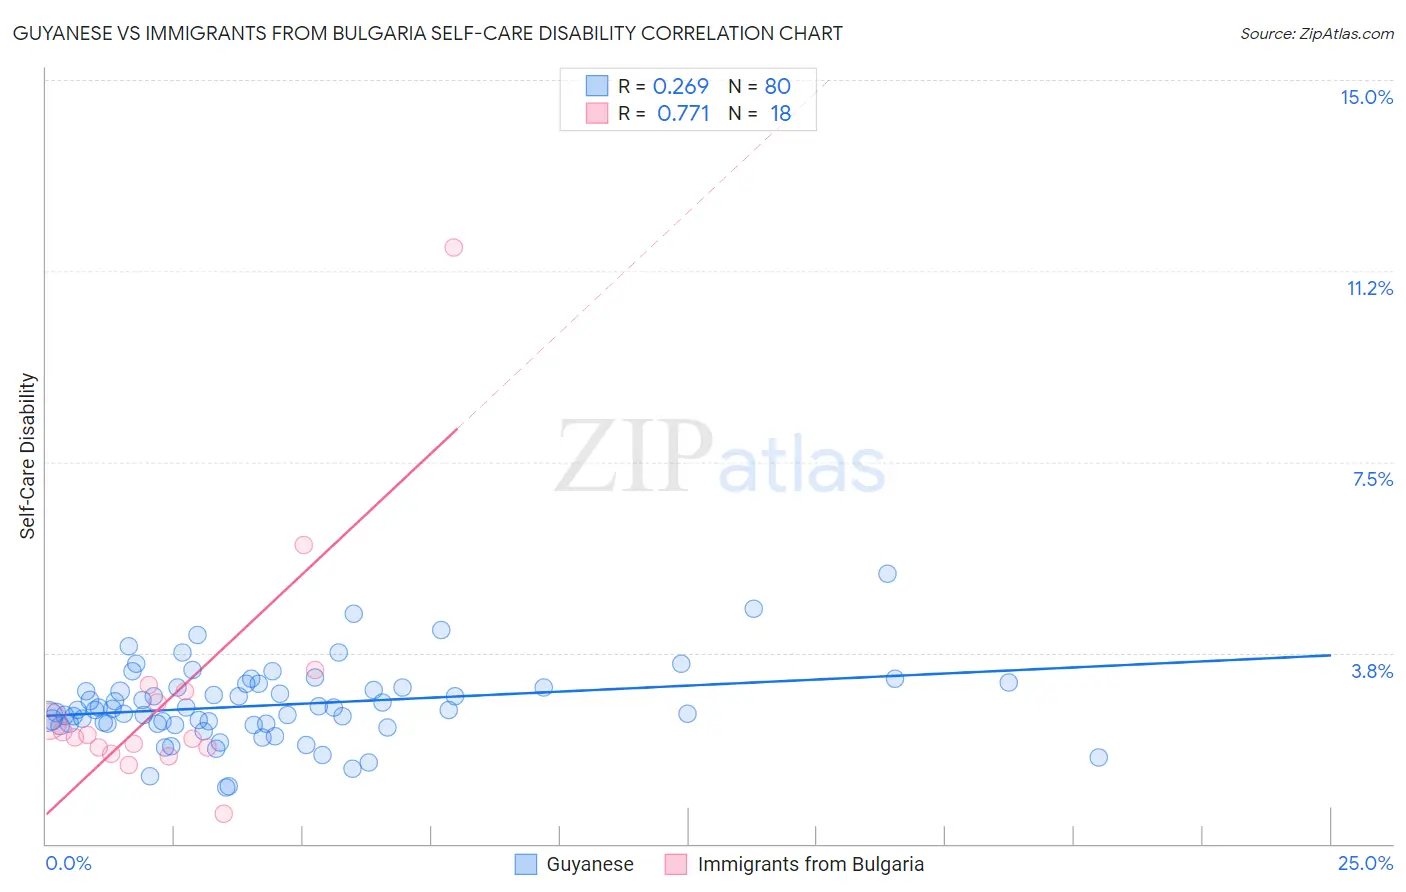
Guyanese vs Immigrants from Bulgaria Self-Care Disability Correlation Chart
The statistical analysis conducted on geographies consisting of 176,718,445 people shows a weak positive correlation between the proportion of Guyanese and percentage of population with self-care disability in the United States with a correlation coefficient (R) of 0.269 and weighted average of 2.7%. Similarly, the statistical analysis conducted on geographies consisting of 172,509,254 people shows a strong positive correlation between the proportion of Immigrants from Bulgaria and percentage of population with self-care disability in the United States with a correlation coefficient (R) of 0.771 and weighted average of 2.3%, a difference of 20.3%.
Self-Care Disability Correlation Summary
| Measurement | Guyanese | Immigrants from Bulgaria |
| Minimum | 1.1% | 0.60% |
| Maximum | 5.3% | 11.7% |
| Range | 4.2% | 11.1% |
| Mean | 2.7% | 2.9% |
| Median | 2.6% | 2.1% |
| Interquartile 25% (IQ1) | 2.3% | 1.9% |
| Interquartile 75% (IQ3) | 3.1% | 3.0% |
| Interquartile Range (IQR) | 0.73% | 1.1% |
| Standard Deviation (Sample) | 0.75% | 2.4% |
| Standard Deviation (Population) | 0.74% | 2.4% |
Similar Demographics by Self-Care Disability
Demographics Similar to Guyanese by Self-Care Disability
In terms of self-care disability, the demographic groups most similar to Guyanese are Central American Indian (2.7%, a difference of 0.16%), Belizean (2.7%, a difference of 0.16%), Blackfeet (2.7%, a difference of 0.16%), Cuban (2.7%, a difference of 0.26%), and Barbadian (2.7%, a difference of 0.31%).
| Demographics | Rating | Rank | Self-Care Disability |
| Fijians | 0.0 /100 | #284 | Tragic 2.7% |
| Jamaicans | 0.0 /100 | #285 | Tragic 2.7% |
| French American Indians | 0.0 /100 | #286 | Tragic 2.7% |
| Immigrants | Jamaica | 0.0 /100 | #287 | Tragic 2.7% |
| Immigrants | Barbados | 0.0 /100 | #288 | Tragic 2.7% |
| Africans | 0.0 /100 | #289 | Tragic 2.7% |
| Cubans | 0.0 /100 | #290 | Tragic 2.7% |
| Guyanese | 0.0 /100 | #291 | Tragic 2.7% |
| Central American Indians | 0.0 /100 | #292 | Tragic 2.7% |
| Belizeans | 0.0 /100 | #293 | Tragic 2.7% |
| Blackfeet | 0.0 /100 | #294 | Tragic 2.7% |
| Barbadians | 0.0 /100 | #295 | Tragic 2.7% |
| Immigrants | Portugal | 0.0 /100 | #296 | Tragic 2.8% |
| West Indians | 0.0 /100 | #297 | Tragic 2.8% |
| Americans | 0.0 /100 | #298 | Tragic 2.8% |
Demographics Similar to Immigrants from Bulgaria by Self-Care Disability
In terms of self-care disability, the demographic groups most similar to Immigrants from Bulgaria are Iranian (2.3%, a difference of 0.040%), Immigrants from Eastern Africa (2.3%, a difference of 0.10%), Immigrants from Sudan (2.3%, a difference of 0.11%), Immigrants from Uganda (2.3%, a difference of 0.21%), and Immigrants from Sweden (2.3%, a difference of 0.23%).
| Demographics | Rating | Rank | Self-Care Disability |
| Burmese | 99.9 /100 | #32 | Exceptional 2.3% |
| Immigrants | Korea | 99.9 /100 | #33 | Exceptional 2.3% |
| Immigrants | Turkey | 99.9 /100 | #34 | Exceptional 2.3% |
| Immigrants | Australia | 99.9 /100 | #35 | Exceptional 2.3% |
| Immigrants | Lithuania | 99.9 /100 | #36 | Exceptional 2.3% |
| Immigrants | Sweden | 99.9 /100 | #37 | Exceptional 2.3% |
| Immigrants | Eastern Africa | 99.9 /100 | #38 | Exceptional 2.3% |
| Immigrants | Bulgaria | 99.8 /100 | #39 | Exceptional 2.3% |
| Iranians | 99.8 /100 | #40 | Exceptional 2.3% |
| Immigrants | Sudan | 99.8 /100 | #41 | Exceptional 2.3% |
| Immigrants | Uganda | 99.8 /100 | #42 | Exceptional 2.3% |
| Immigrants | Pakistan | 99.8 /100 | #43 | Exceptional 2.3% |
| Immigrants | South Africa | 99.8 /100 | #44 | Exceptional 2.3% |
| Norwegians | 99.8 /100 | #45 | Exceptional 2.3% |
| Czechs | 99.8 /100 | #46 | Exceptional 2.3% |