Guyanese vs Finnish Self-Care Disability
COMPARE
Guyanese
Finnish
Self-Care Disability
Self-Care Disability Comparison
Guyanese
Finns
2.7%
SELF-CARE DISABILITY
0.0/ 100
METRIC RATING
291st/ 347
METRIC RANK
2.4%
SELF-CARE DISABILITY
67.0/ 100
METRIC RATING
160th/ 347
METRIC RANK
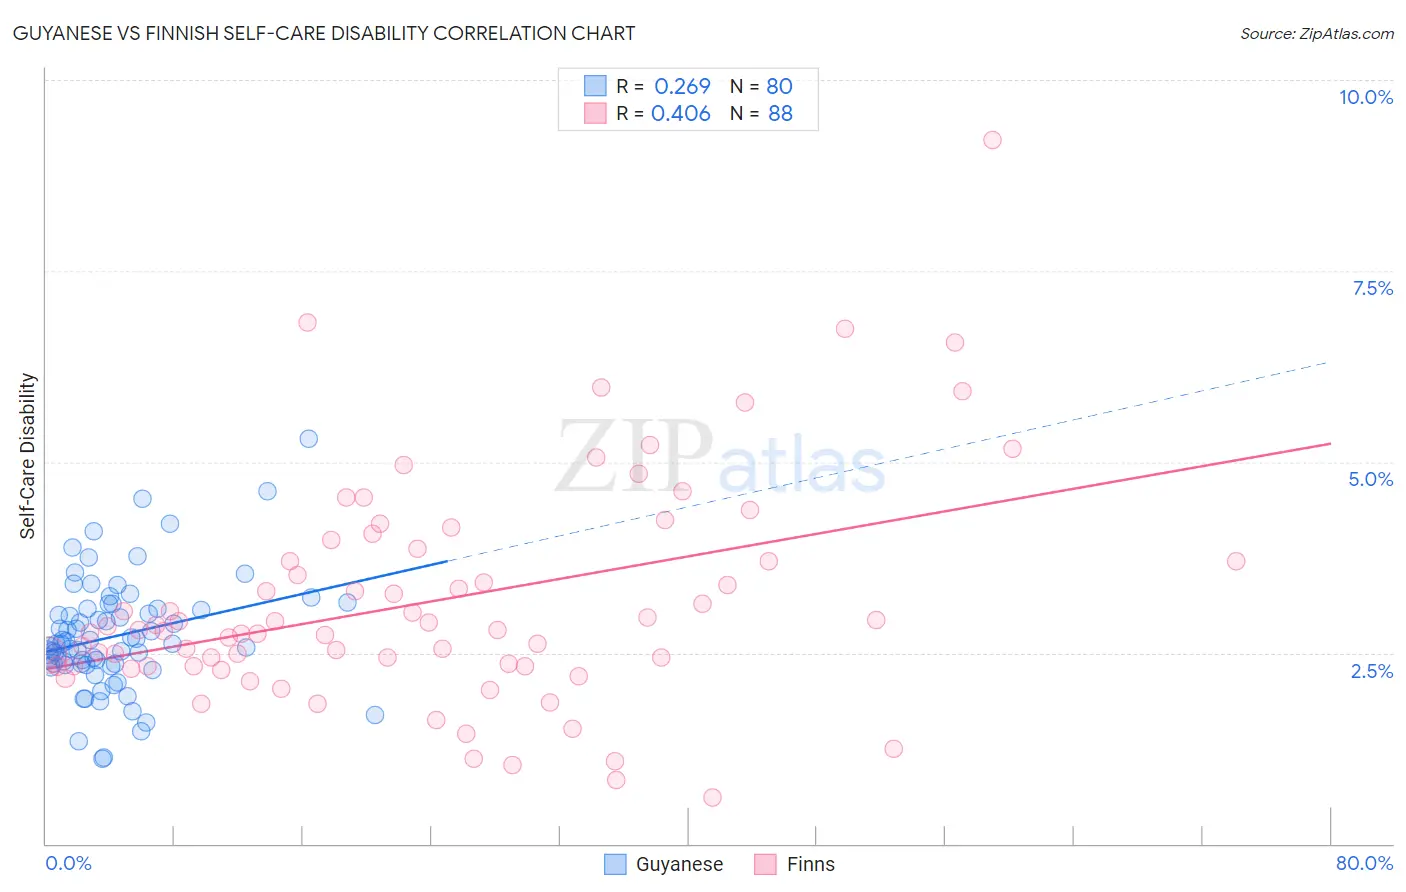
Guyanese vs Finnish Self-Care Disability Correlation Chart
The statistical analysis conducted on geographies consisting of 176,718,445 people shows a weak positive correlation between the proportion of Guyanese and percentage of population with self-care disability in the United States with a correlation coefficient (R) of 0.269 and weighted average of 2.7%. Similarly, the statistical analysis conducted on geographies consisting of 404,111,559 people shows a moderate positive correlation between the proportion of Finns and percentage of population with self-care disability in the United States with a correlation coefficient (R) of 0.406 and weighted average of 2.4%, a difference of 11.9%.
Self-Care Disability Correlation Summary
| Measurement | Guyanese | Finnish |
| Minimum | 1.1% | 0.60% |
| Maximum | 5.3% | 9.2% |
| Range | 4.2% | 8.6% |
| Mean | 2.7% | 3.2% |
| Median | 2.6% | 2.8% |
| Interquartile 25% (IQ1) | 2.3% | 2.3% |
| Interquartile 75% (IQ3) | 3.1% | 3.8% |
| Interquartile Range (IQR) | 0.73% | 1.5% |
| Standard Deviation (Sample) | 0.75% | 1.5% |
| Standard Deviation (Population) | 0.74% | 1.5% |
Similar Demographics by Self-Care Disability
Demographics Similar to Guyanese by Self-Care Disability
In terms of self-care disability, the demographic groups most similar to Guyanese are Central American Indian (2.7%, a difference of 0.16%), Belizean (2.7%, a difference of 0.16%), Blackfeet (2.7%, a difference of 0.16%), Cuban (2.7%, a difference of 0.26%), and Barbadian (2.7%, a difference of 0.31%).
| Demographics | Rating | Rank | Self-Care Disability |
| Fijians | 0.0 /100 | #284 | Tragic 2.7% |
| Jamaicans | 0.0 /100 | #285 | Tragic 2.7% |
| French American Indians | 0.0 /100 | #286 | Tragic 2.7% |
| Immigrants | Jamaica | 0.0 /100 | #287 | Tragic 2.7% |
| Immigrants | Barbados | 0.0 /100 | #288 | Tragic 2.7% |
| Africans | 0.0 /100 | #289 | Tragic 2.7% |
| Cubans | 0.0 /100 | #290 | Tragic 2.7% |
| Guyanese | 0.0 /100 | #291 | Tragic 2.7% |
| Central American Indians | 0.0 /100 | #292 | Tragic 2.7% |
| Belizeans | 0.0 /100 | #293 | Tragic 2.7% |
| Blackfeet | 0.0 /100 | #294 | Tragic 2.7% |
| Barbadians | 0.0 /100 | #295 | Tragic 2.7% |
| Immigrants | Portugal | 0.0 /100 | #296 | Tragic 2.8% |
| West Indians | 0.0 /100 | #297 | Tragic 2.8% |
| Americans | 0.0 /100 | #298 | Tragic 2.8% |
Demographics Similar to Finns by Self-Care Disability
In terms of self-care disability, the demographic groups most similar to Finns are Lebanese (2.4%, a difference of 0.030%), Immigrants from Italy (2.4%, a difference of 0.080%), Immigrants from Western Europe (2.4%, a difference of 0.090%), Immigrants from Europe (2.4%, a difference of 0.14%), and Somali (2.5%, a difference of 0.17%).
| Demographics | Rating | Rank | Self-Care Disability |
| Immigrants | England | 73.5 /100 | #153 | Good 2.4% |
| Italians | 72.2 /100 | #154 | Good 2.4% |
| Pakistanis | 71.4 /100 | #155 | Good 2.4% |
| Nigerians | 70.6 /100 | #156 | Good 2.4% |
| Immigrants | Europe | 69.6 /100 | #157 | Good 2.4% |
| Immigrants | Western Europe | 68.6 /100 | #158 | Good 2.4% |
| Immigrants | Italy | 68.5 /100 | #159 | Good 2.4% |
| Finns | 67.0 /100 | #160 | Good 2.4% |
| Lebanese | 66.5 /100 | #161 | Good 2.4% |
| Somalis | 63.7 /100 | #162 | Good 2.5% |
| German Russians | 62.7 /100 | #163 | Good 2.5% |
| Immigrants | Vietnam | 59.3 /100 | #164 | Average 2.5% |
| Syrians | 59.0 /100 | #165 | Average 2.5% |
| Canadians | 58.8 /100 | #166 | Average 2.5% |
| Immigrants | Greece | 57.3 /100 | #167 | Average 2.5% |