Guyanese vs U.S. Virgin Islander Family Poverty
COMPARE
Guyanese
U.S. Virgin Islander
Family Poverty
Family Poverty Comparison
Guyanese
U.S. Virgin Islanders
11.2%
FAMILY POVERTY
0.1/ 100
METRIC RATING
278th/ 347
METRIC RANK
12.4%
FAMILY POVERTY
0.0/ 100
METRIC RATING
318th/ 347
METRIC RANK
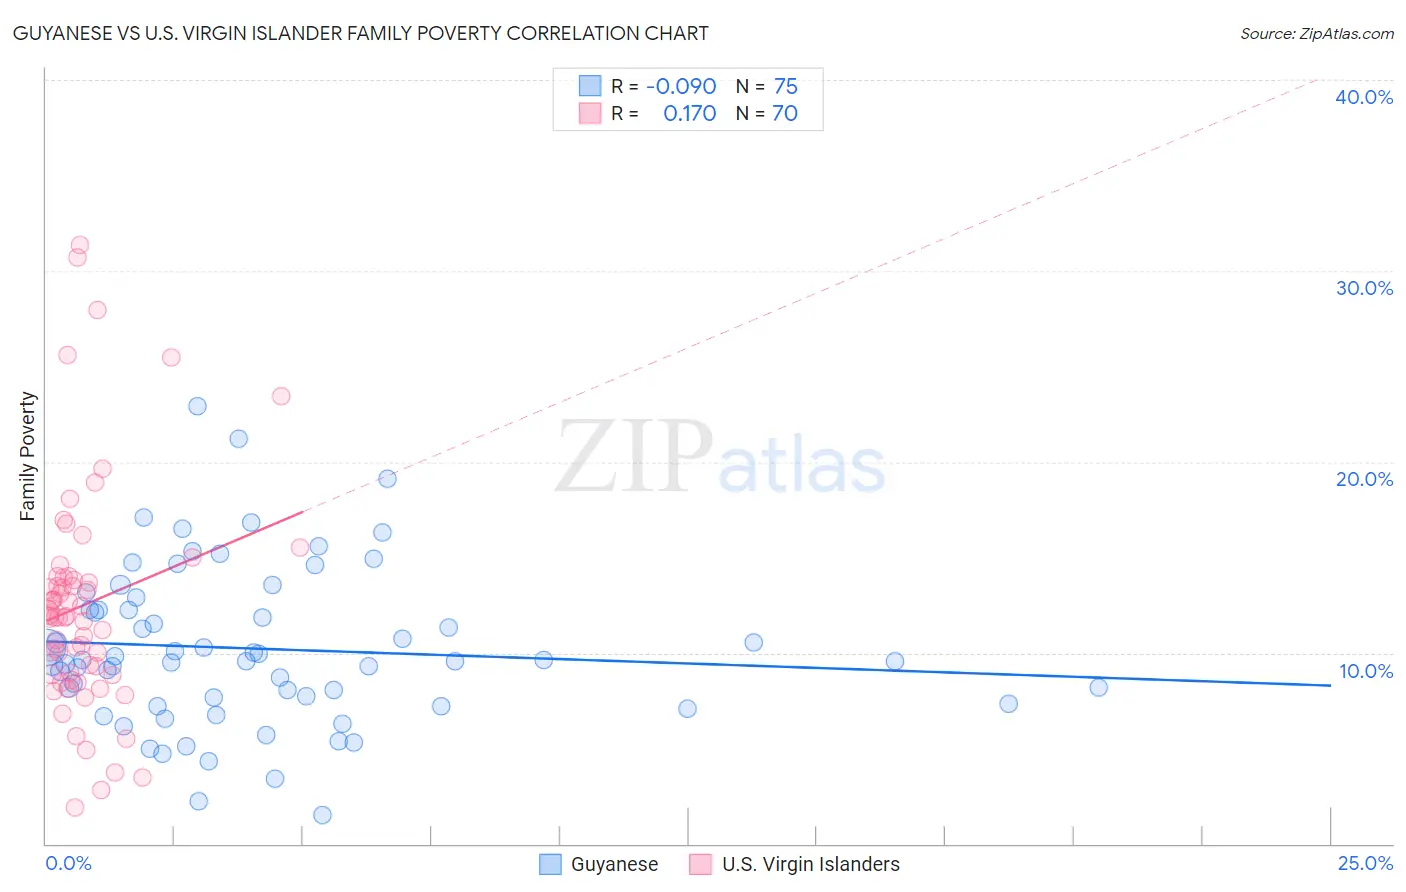
Guyanese vs U.S. Virgin Islander Family Poverty Correlation Chart
The statistical analysis conducted on geographies consisting of 176,578,475 people shows a slight negative correlation between the proportion of Guyanese and poverty level among families in the United States with a correlation coefficient (R) of -0.090 and weighted average of 11.2%. Similarly, the statistical analysis conducted on geographies consisting of 87,485,330 people shows a poor positive correlation between the proportion of U.S. Virgin Islanders and poverty level among families in the United States with a correlation coefficient (R) of 0.170 and weighted average of 12.4%, a difference of 10.3%.
Family Poverty Correlation Summary
| Measurement | Guyanese | U.S. Virgin Islander |
| Minimum | 1.5% | 1.9% |
| Maximum | 22.9% | 31.4% |
| Range | 21.5% | 29.5% |
| Mean | 10.2% | 12.5% |
| Median | 9.6% | 11.9% |
| Interquartile 25% (IQ1) | 7.3% | 8.9% |
| Interquartile 75% (IQ3) | 12.3% | 14.0% |
| Interquartile Range (IQR) | 4.9% | 5.1% |
| Standard Deviation (Sample) | 4.2% | 5.9% |
| Standard Deviation (Population) | 4.1% | 5.9% |
Similar Demographics by Family Poverty
Demographics Similar to Guyanese by Family Poverty
In terms of family poverty, the demographic groups most similar to Guyanese are Chippewa (11.2%, a difference of 0.030%), Immigrants from Guyana (11.2%, a difference of 0.12%), Central American (11.2%, a difference of 0.14%), Blackfeet (11.3%, a difference of 0.14%), and Belizean (11.3%, a difference of 0.18%).
| Demographics | Rating | Rank | Family Poverty |
| Immigrants | Bahamas | 0.1 /100 | #271 | Tragic 11.1% |
| Immigrants | Jamaica | 0.1 /100 | #272 | Tragic 11.2% |
| Somalis | 0.1 /100 | #273 | Tragic 11.2% |
| Spanish Americans | 0.1 /100 | #274 | Tragic 11.2% |
| Central Americans | 0.1 /100 | #275 | Tragic 11.2% |
| Immigrants | Guyana | 0.1 /100 | #276 | Tragic 11.2% |
| Chippewa | 0.1 /100 | #277 | Tragic 11.2% |
| Guyanese | 0.1 /100 | #278 | Tragic 11.2% |
| Blackfeet | 0.0 /100 | #279 | Tragic 11.3% |
| Belizeans | 0.0 /100 | #280 | Tragic 11.3% |
| Immigrants | West Indies | 0.0 /100 | #281 | Tragic 11.3% |
| Immigrants | Cuba | 0.0 /100 | #282 | Tragic 11.3% |
| Indonesians | 0.0 /100 | #283 | Tragic 11.3% |
| Yaqui | 0.0 /100 | #284 | Tragic 11.3% |
| Barbadians | 0.0 /100 | #285 | Tragic 11.3% |
Demographics Similar to U.S. Virgin Islanders by Family Poverty
In terms of family poverty, the demographic groups most similar to U.S. Virgin Islanders are Immigrants from Grenada (12.4%, a difference of 0.010%), British West Indian (12.4%, a difference of 0.050%), Honduran (12.4%, a difference of 0.22%), Inupiat (12.5%, a difference of 0.53%), and Immigrants from Mexico (12.3%, a difference of 0.96%).
| Demographics | Rating | Rank | Family Poverty |
| Ute | 0.0 /100 | #311 | Tragic 12.1% |
| Immigrants | Central America | 0.0 /100 | #312 | Tragic 12.1% |
| Immigrants | Caribbean | 0.0 /100 | #313 | Tragic 12.2% |
| Kiowa | 0.0 /100 | #314 | Tragic 12.2% |
| Immigrants | Mexico | 0.0 /100 | #315 | Tragic 12.3% |
| Hondurans | 0.0 /100 | #316 | Tragic 12.4% |
| Immigrants | Grenada | 0.0 /100 | #317 | Tragic 12.4% |
| U.S. Virgin Islanders | 0.0 /100 | #318 | Tragic 12.4% |
| British West Indians | 0.0 /100 | #319 | Tragic 12.4% |
| Inupiat | 0.0 /100 | #320 | Tragic 12.5% |
| Arapaho | 0.0 /100 | #321 | Tragic 12.7% |
| Immigrants | Honduras | 0.0 /100 | #322 | Tragic 12.7% |
| Menominee | 0.0 /100 | #323 | Tragic 12.7% |
| Immigrants | Dominica | 0.0 /100 | #324 | Tragic 12.7% |
| Paiute | 0.0 /100 | #325 | Tragic 13.0% |